i NEWS PAKISTAN
Sinking in Debt:
A Framework of Debt Relief for Low-Income Countries
Ashfaque Hasan Khan
NUST Institute of Policy Studies (NIPS) NUST | Islamabad
Author
Dr. Ashfaque Hasan Khan, Director General, NIPS
Formatted & prepared for printing by Sayyeda Aqsa Sajjad, Research Associate, NIPS Tayyaba Razzaq, Research Associate, NIPS Aleena Zahra, Research Intern, NIPS
Cover page designed by
Hannan Rashid, Assistant Director, NIPS Prepared and printed in Pakistan by NUST Institute of Policy Studies
National University of Sciences and Technology (NUST)
Chapter I: Introduction
“Modern Slaves are not in Chains; they are in debt”
Anonymous
The global economy is currently facing multidimensional, complex and yet interconnected challenges. These challenges include:
- i) decades high inflation, ii) extra-ordinarily high interest rates, iii) slowing economic growth, vi) Lessor job creation, v) stronger dollar owing to higher interest rate in the US, vi) rising debt and growing debt distress in developing countries, vii) slowing Chinese economy owing to trouble in real estate market, viii) global fragmentation in trade and investment, and ix) climate The combination of these challenges has coalesced into what can be described as ‘polycrisis’ (Faingold 2023). 1
- The author is Director General, NUST Institute of Policy Studies of the National University of Sciences and Technology (NUST), Islamabad. This document is the revised, updated and the expanded version of author’s lecture presented as Allama Iqbal Lecture at the 37th Annual Conference of the Pakistan Society of Development Economists (PSDE), organised by the Pakistan Institute of Development Economics (PIDE) at Bahauddin Zakaria University, Multan during November 20-23, 2023. A section of this manuscript was part of the document prepared by the experts from the Asian Development Bank Institute (ADBI) including the author on Debt Relief submitted by the Asian Development Bank Institute (ADBI), Tokyo at the G-7 Summit in April 2023 in Hiroshima, Japan. Comments from the participants of the PSDE and from the professional staff of the ADBI led by John Beirne are greatly Thanks are also due to Khan Waiz, the author’s Personal Assistant, who typed several drafts of this manuscript.
1 Polycrisis is defined as the simultaneous occurrence of several catastrophic events.
While the global economy was returning to a ‘new normal’ in 2021 and 2022 following the Covid 19 Pandemic, it was struck by the invasion of Russia on Ukraine – the most dangerous conflagration in Europe since the World War II, ushering in a fresh series of crisis in food and energy and triggering problems that will require decades to address them effectively (WEF 2023). As a result, the world economy has entered into rough water in 2023 and 2024. Global economic growth is projected to remain stagnant at approximately 3.25 percent of 2023 level in the next two years, that is, 2024 and 2025 and not likely to attain the growth level of pre-Covid 19 Pandemic. And this is happening at a time when the developing countries are facing catastrophic debt burden amid changing composition of debt in favour of non-traditional official creditors, commercial lenders, and private creditors. Such changing shares of the debt have made the task of the debt relief even more challenging for developing countries.
As if, it was not enough to give sleepless night to policy makers, the war in Gaza erupted which polarised the world with the United States, Israel and few allies of the United States standing on the one side and the rest of the world on the other.2 All these developments have not only compounded the economic challenges currently faced by the global economy but heightened the geopolitical and geoeconomic tensions leading to economic, financial and investment fragmentation – a case of perfect storm or ‘polycrisis’ (Faingold 2023).
2 On the basis of the voting at the United Nations on the issue of war in Gaza. Economic ties among the nations are important for global peace and prosperity; more so for developing countries in general and low- income countries (LICs) in particular. Rising geoeconomic tensions are not at all conducive for the consideration of debt relief for LICs. Unfortunately, the two wars, one in Europe (Russia-Ukraine War) and the second one in the Middle East (Israeli-Palestinian conflict in Gaza) have changed the world in many ways.
The trade and technology wars between the two superpowers (US and China) were already raging since 2016, the Russian invasion of Ukraine changed the global economic ties in ways that were not seen since the end of the cold war. Firstly, this war has changed the global politics monumentally forever. Secondly, this war has seen the United States and its western allies using economic sanctions and dollar as weapons of war on the one hand and in response, Russia using energy as weapons of war on the other.3 Thirdly, this war has accelerated the pace of the expansion of the BRICS, movement towards a new global financial architecture, discussion on de-dollarisation gaining tractions in global south and the search for an alternative reserve currency also gaining momentum. Policy level discussions in the NATO, European Union and the US on de-coupling and de-risking gained traction. All these developments have fragmented global economy, global finances, global trade and investment. Trade and investment flows are now redirected along geopolitical lines. 4 A large number of countries are evaluating their heavy reliance on the dollar for their international transactions and reserve holdings.
As stated above, the Russia-Ukraine War has changed the world forever. The World after February 24, 2022, has changed dramatically. Clearly, the World appears to have been divided in three blocs – a US leaning bloc; a China leaning bloc; and a bloc of countries currently non-aligned but watching the developments closely from the side-line. The fragmentation of global economy would force the third bloc, sooner or later, to choose side one way or the other. The ‘new normal’ in international relations is that “either you are with us, or you are against us”, or zero-sum game has become the norm. There is just no option left to remain non-aligned forever anymore. The signs of growing new economic ties in line with fragmentation are already emerging. For example, trade growth between the US leaning bloc and China leaning block is down by almost 5 percentage points during 2022 Q2- 2023 Q3 as compared with 2017 Q1-2022 Q1 (Gopinath 2024). Europe is buying more gas from Norway and from the US in 2023 as compared to Russia in 2020. Europe has diversified its gas import from Russia to Norway and to the US, even at a very high cost. EU’s wholesale gas prices are now about twice as high as those to Russia before its invasion of Ukraine. Russia on the other hand has diversified its sale of gas to China and India. Similarly, trade growth within the bloc is 1.5 percentage point faster than between the blocs. Furthermore, fragmentation of outward FDI flows is also visible. Prior to the acceleration of geopolitical tensions, the destination of global FDI was
largely driven by geographical closeness and profitability. Today, the flow of global FDI is largely driven by geopolitical alignments.5 Such developments during the post Russia-Ukraine War, like cross-border restriction in trade and FDI, are giving birth to geoeconomic fragmentation. These restrictions have now emerged as new instruments of war in geoeconomics and certainly not in the interest of global prosperity. Fragmentation of trade and investment would reshape the global economy. Imposition of trade restrictions would be harmful for global trade. It would reduce competition, limit economies of scale and would diminish efficiency in trade. Fragmentation of investment (FDI) would affect emerging and developing countries much more than the advanced economies. Emerging and developing countries are heavily dependent on the FDI from the advanced economies. The local firms of these countries would be deprived of the positive spillovers from the FDI. Financial fragmentation would limit capital accumulation in emerging and developing countries because of the reduced FDI flows. It would enhance financial volatility and financial risks. Furthermore, financial fragmentation could lead to re-alignment of foreign exchange reserves to reflect new economic ties.
All in all, the world has changed altogether since Russia’s invasion of Ukraine. The recent war in the Middle East has further deepened the divisions of the world in line of the three blocs discussed above. The fragmentation of global economy, global finances, global trade and investment and most importantly global politics would accelerate geopolitical and geoeconomic tensions. This is nothing but a stunning reversal of economic integration. We have seen that since the end of the cold war, the size of the global economy roughly tripled and nearly 1.5 billion people were lifted out of the extreme poverty. This was the dividend of economic integration. From economic integration to economic fragmentation is a collective policy mistakes that would leave everyone poorer and less secure.6 Unfortunately, fragmentation of global economy is now a reality. It has its own dynamics and hence, we may see more deeper fragmentation and a rising geopolitical and economic tensions among the US and China leaning blocs. The worst affectees would be the low-income developing countries – most of them currently aligned with non-aligned countries bloc.
Global public debt is rising at a faster pace. It has increased more than four-fold over the last two decades – rising from $22 trillion in 2000 to $97 trillion in 2023. It has increased 40 percent since 2019 (See Conte 2023). A large number of developing countries, especially low- income developing countries are either on the brink or already in debt distress. According to the United Nations, a total of 52 countries – almost 40 percent of the developing world – are experiencing serious debt crisis.7 Similarly, according to the IMF, some 36 countries are on so-called “debt row” (as opposed to “death row”), that is, either they are already a debt distress or at high risk of debt distress. Another 16 countries are paying high interest rates to private creditor. These developing countries including Pakistan have been forced into a choice between servicing their debts or servicing their people. Because of the crushing debt burden, nearly half of the world’s population is sinking into a development disaster. These countries are spending more in debt interest payments than on education and health (Guterres 2023; Aljazeera 2023).
In 2024, the debt situation of developing countries is likely to worsen; more low-income developing countries are expected to face debt distress or are at risk of debt distress. IMF estimates that 9 countries are in debt distress and 51 countries are at moderate to high risk of debt distress. Out of these 60 countries, 39 are in Africa because they have suffered heavily from Covid-19 Pandemics, the war in Ukraine and the spillover effects of the prevailing high interest rates in many developed countries.8 In the last three years (2020-2023), some
165 million additional people in low and lower-middle income countries fell into poverty owing to heavy debt payment. Empirical evidence found strong correlation between high levels of debt, insufficient social spending, and alarming increase in poverty.9 The developing countries in general and low-income countries (LICs) in particular are facing catastrophic debt crisis. The Covid-19 pandemic, Ukraine War, a high-interest rate environment, and deepening climate crisis have further compounded their difficulties. Many of them are likely to experience disorderly debt defaults, if no comprehensive debt relief are provided to them urgently. The current global geopolitical environment, although offers little hope to these countries, but efforts must be made to prevent disorderly debt defaults in many countries. Hence, inclusion and not exclusion; cooperation and not confrontation at the global level is required to minimize fragmentation, for which, a legitimate dialogue, continuous meaningful engagement between the two superpowers- US and China are necessary to minimize fragmentation. A conducive and cooperative environment is absolutely necessary for consideration of the debt relief framework that this paper presents for the low-income countries. As it is said, the economic fragmentation is now a reality. In this background that we appeal to the two superpowers to ensure that the low-income countries do not suffer. There should not be any compromise on providing comprehensive debt relief to the LICs.
In this paper we present a comprehensive debt relief framework for the LICs. This is an important issue for over 3.0 billion people. This issue is urgent because these countries are paying bulk of their revenues in debt payment at the cost of providing health, education and social protection to their people. The plan of the paper is as follows: in Section II, we discuss, though briefly, the trends and consequences of rising global debt situation. We identify the factors responsible for the surge in global public debt. Section III discusses the trends, consequences and the reasons for the deterioration of public debt in the low-income developing countries. In Section IV, we present the trends, the structure and the reasons for the surge in external debt and liabilities of Pakistan. We also discuss the consequences for the unprecedented growth in public and external debt for the economy as a whole as well as for the country’s national security. In this section, we identify at least two factors which have played havoc for the country’s public and external debt.
In Section V, we discuss the initiatives taken by the G- 20 Countries in providing debt relief to the LICs. Here we identify the challenges that these countries have faced while dealing with G-20 Debt Relief Initiative and why this initiative was sub-optimal. In Section VI, we present the framework for a comprehensive debt relief in which we propose to bring bilateral, multilateral and private creditors into the fold. Without these three creditors working in unison, no meaningful debt relief can be provided to the LICs. How can this Framework be implemented is discussed in Section VII, and the paper ends with concluding remarks in Section VIII.
Chapter II: Global Debt Situation
“Rather go to bed without dinner than to rise in debt”.
Benjamin Franklin
Borrowing from within and outside the country is a normal part of economic activity. Governments borrow to finance their expenditures on infrastructure-related projects as well as for the development of human capital that include spending on education and health. Such spending contributes to economic growth and development and increases the debt carrying capacity of the countries. However, if the countries borrow too much, too fast and spend money on low economic and social return projects; it creates heavy burden of debt which leads to financial instability, economic downturns, and create challenges for debt repayment. This is exactly what is happening today, especially across the developing world. The burden of the debt has increased substantially in developing countries for several reasons including limited access to financing, rising cost of borrowing owing to the surge in global interest rates, devaluation of their currencies and poor growth performance. Today, some 3.3 billion people live in countries that spend much more on interest payments than on education, health and social sector development.10 This is a substantial drag to sustainable development.
Global debt refers to the borrowings of the governments, businesses and households across the world. It includes public debt 10 Guterres (2023). (governments), corporate debt (businesses) and household debt. Global debt has reached a record high of $313 trillion or nearly 330% of GDP by the end of 2023 – some $15.0 trillion more than the last year (2022). Global debt stood at $298 trillion by the end of 2022 or 342% of GDP. The distribution of global debt suggests that two-third (66.5%) is owed to advanced/matured economies and the remaining one-third (33.3%) is owed to emerging market (See Table 1).

Source: IFF, Global Debt Monitor, February 21, 2024, Washington, DC
Further distribution of global debt suggests that more than one- half (52.3%) of the global debt is owed to businesses followed by governments (28.7%) and the remaining 18.9% to households in 2023 (See table 2).

Source: IFF, Global Debt Monitor, February 21, 2024, Washington, DC
Global debt has been on the rise with threatening pace over the last five years, adding over $100 trillion to the stock of debt. Global debt was already very high in 2019 at close to $75 trillion (or 227% of GDP) but surge to $305 trillion or 250% of GDP in 2020 as the world was hit by the Covid -19 pandemic and the resultant deep recession. The increase in global debt in 2020 was the biggest one-year surge since the World War II. In 2021, global debt reached a record $303 trillion, a further jump from what was the record level of debt in 2020. The increase in 2021 was indeed the new largest surge in global debt since the World War II. Global debt increased by $77 trillion to reach 336 percent of GDP in 2021, mainly on account of the unprecedented increase in Pandemic-related expenditures worldwide.11
Global debt witnessed its first decline in dollar term in 2022 since 2015 owing to the rebound in global economy. Global debt declined by $4 trillion in 2022 to reach below $300 trillion, threshold breached in 2021. It stood at $298 trillion in 2022 or 332 percent of GDP.12 This decline was entirely driven by the advanced economies whose debt-declined by $6 trillion to $200 trillion. Developing countries debt however increased by $2.0 trillion to hit a new record of
11 World Economic Forum (2023), “What is Global Debt – and how high is it Now?”. Financial and Monetary System, December 21. (https://www.weforum.org/agenda/2023/12/what-is-global-debt-why-high/#).
12 Emre Tiftik, Khadija Mahmood and Raymond Aycock (2023), “Global Debt Monitor: A Many – Faceted Crisis”, Institute of International Finance, February 22, Washington DC. $98 trillion in 2022 - rising from $75 trillion in 2019 - an increase of $23 trillion in five years.13 After the decline in 2022, global debt once again surged to $313 trillion in 2023 – rising by $15 trillion. Of which, 55 percent increase originated from mature or advanced economies ($8.25 trillion) and the remaining 45 percent ($6.75 trillion) came from emerging economies. The global debt-to-GDP ratio witnessed another
2.0 percentage points decline to 330 percent in 2023.14 Thus far we have discussed the unprecedented rise of global debt which includes debts of governments, businesses, and people (households). But what is relevant for the paper is the debts of the government, that is, public debt which includes general government domestic and external debt. Like total global debt, public debt also continued to maintain its accelerating trend in recent years owing to cascading crises, slower and uneven growth performance, devaluation, rising interest rates etc. Global public debt almost doubled in the last 13 years to reach $97 trillion in 2023 from almost
$50 trillion in 2010. Public debt at $97 trillion (or 92.4% of GDP) in 2023 is $5.6 trillion higher than previous year (See Figure 1) and 40% more than 2019.15 Taking a longer-term view, the global public debt increased more than four times since 2000 while the global GDP during the same time increased by slightly over three times. In other words,
14 Emre Tiftik, Khadija Mahmood and Raymond Aycock (2024), “Global Debt Monitor: Politics, Policy, and Debt Markets – What to watch in 2024”, Institute of International Finance, February 21, Washington DC. 15 UNCTAD (2024), A World of Debt: A Growing Burden to Global Prosperity, Report 2024 UNCTAD, Geneva. the rise in global public debt has outpaced global GDP – thereby increasing the burden of debt.
Figure 1: Public debt reaches record levels in 2023
(Global public debt in US$ trillion)

Out of the total global public debt of $97 trillion, some $29 trillion or 30 percent is owed by the developing countries while the remaining $68 trillion or 70 percent is owed by the developed world. Within the developed world, the United States alone accounts for one- half and along with Japan, they account for almost two-thirds of the global public debt. When the UK, France, Italy and Germany are added, these six advanced economies account for almost 79% of developed world debt. Within the developing countries, 72 percent
public debt is owed to China, India, Brazil, Mexico and Egypt (See Figure 2). 16
Figure 2:
Almost a third of global public debt is owed by developing countries
Public debt in US$ billion (2023)
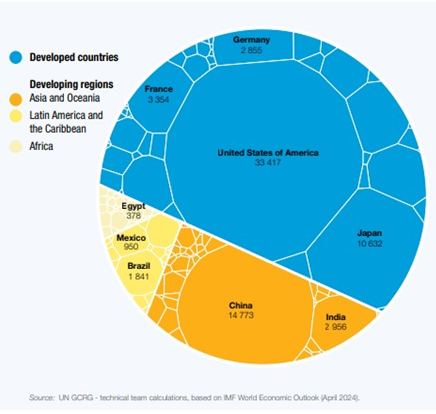
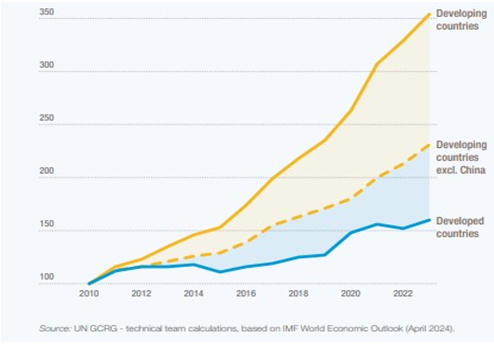
Since 2010, public debt of the developing countries has been rising at a twice the rate of that in developed countries (See Figure 3).
Figure 3:
Public debt grows twice as fast in developing countries Index: Outstanding public debt in 2010=10
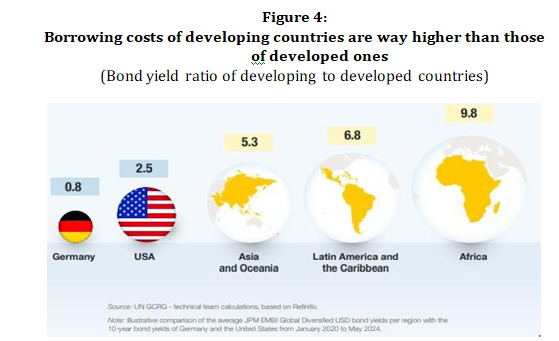
Several factors have contributed to the differential pace of the rise in public debt of developing countries. These include the growing financing needs for COVID-19 related expenditure, the rising interest rates increasing the financing requirements, weaken global growth, and inadequate global financial architecture forcing developing countries to borrow from more expensive sources. It has been observed that the developing countries have been borrowing money at rates 2 to 4 times higher than those of the United States (2.5%) and 6 to 8 times higher than those of Germany (0.8%). Countries in Africa, on average, borrowed at rates (9.8%) that were four times higher than those of the United States (2.5%) and eight times higher than those of Germany 0.8%, (See Figure 4). 17
Naturally the high borrowing costs siphoned off a large sum of resources of developing countries for the repayment of debts, which forced them to borrow more for infrastructure, education and health development. The recent inflationary build up, especially since 2022, and the consequential rise in interest rates by the Central Banks around the world have had direct adverse impact on the budgets of developing countries. Net interest payments on public debt reached $847 billion in 17 Ibid.
2023 – an increase of 26 percent since 2021. 18 Currently more than half of developing countries are consuming, on average, 8 percent of government revenues for interest payments which has almost doubled in the last one decade. Some 54 developing countries or 38 percent are allocating 10 percent or more of government revenue to interest payments – nearly half of them in Africa.19 20 It was only 29 developing countries in 2010 (See Figure 5).

Interestingly, Pakistan is spending almost 60 percent of its revenue on interest payments – far more than many African countries. In other words, debt situation of developing countries has worsened in the last one decade. This leads to our discussion on the trends of developing as well as low-income developing countries’ overall public debt and public external debt in the following pages.
Chapter III: Debt Situation of Developing Countries
“There are no shortcuts when it comes to getting out of debt”.
Dave Ramsey
Developing countries in general and the low-income countries in particular are facing serious debt crisis. Public debt of developing countries has surged to a record $29 trillion in 2023, accounting for 30 percent of the global public debt ($97 trillion). It has increased from $6.6 trillion or 16 percent of the global public debt in 2010 – to $29 trillion or 30 percent of global public debt in 2023 – nearly doubled in the last 13 years. 21As stated earlier, nearly three-fourth of developing countries’ public debt is accounted by only five countries (China, India, Brazil, Mexico and Egypt) (See Figure 2). The speed with which public debt grew in developing countries, some 59 of them faced debt-to-GDP ratio in excess of 60 percent – increasing from only 22 in 2011. 22
Developing countries’ debt crisis originated from the oil price shocks of 1973-74 and 1979. The two oil price shocks led to the many fold increase in prices of oil in international market. While developed countries experienced massive inflationary build up, their Central Banks raised interest rates to quell inflationary pressures. The developing countries on the other hand, witnessed serious balance of
21 UNCTAD (2024).
22 Public debt level of 60 percent of GDP is used as benchmark by the IMF to assess debt burdens in emerging market. Pakistan’s Fiscal Responsibility and Debt Limitation Act 2005 also considers 60 percent of GDP as the benchmark debt level. For more on this see UNCTAD (2023) and Ministry of Finance (2002). payment crisis as their oil import bills surged many folds. The oil exporting countries earned excessive oil revenue which they parked in the commercial banks of the Western Countries. Banks of the Western countries had huge funds available, therefore, they were looking for customers to lend money. Developing countries in dire need of money to minimize the impact of the rising oil prices, borrowed heavily from commercial banks. Hence, the excess profit of the oil producing countries went to the commercial banks of the west and the banks lent these monies to the developing countries – this phenomenon can be described as the recycling of petrodollar.
The second oil shock of 1979 further contributed to inflationary build up. Western Central Banks increased interest rates resulting in economic recession in western economies which were the markets of developing countries. It further aggravated the balance of payments of developing countries. Western Commercial Banks further extended loan to the developing countries to meet their external financing gap. With interest rates significantly reaching at higher levels, dramatically increased the costs of debt servicing and threw the developing countries into serious debt crisis in the 1980s.23 Many developing countries went to the IMF for the balance of payment support. They implemented the structural adjustment program of the IMF. The debt problem, instead of improving, in fact further aggravated resulting into the launch of the Highly Indebted Poor Countries (HIPC) initiative
23 See Hurt (2023), “Third World Debt”, Encyclopedia Britannica, December 13, 2023 (https://www.britannica.com/money/Third-World-debt.) in 1996. Debt crisis of the developing countries, on average, continued to deteriorate. There are two messages here. First, the Western Commercial banks recklessly extended loans to developing countries and second, that the IMF initiated Structural Adjustment Programs were not properly designed to handle such issues. Instead of addressing their problems, these policies had further compounded their difficulties.24
Developing countries public debt continued to deteriorate since the 1980s but more so in recent years, owing to a variety of reasons that include Pandemic-related expenditures, rising interest rates, devaluation of their currencies on account of strengthening US dollar, weakening of global growth, falling commodity prices, high prices of energy, food and fertilizer because of Russia-Ukraine War as well as war in Gaza. All these factors drained their foreign exchange reserves making it harder for developing countries to service their debts and forcing them to borrow more to meet their expenditures and fill their balance of payment gaps. Along with rising debt levels, the developing countries witnessed a shift in the cost of the debt which became far more expensive for them. Developing countries borrowed at rates that were 2 to 4 times higher than those of the United States and 6 to 12 times higher than those of Germany. Net interest payments on public debt reached $847 billion in 2023 – an increase of 26 percent since
24 Developing Countries debt crisis took prominence in August 1982 when Mexico declared that it could no longer meet the repayments on its external debt (See Hurt 2023). 2021.25 Taken together, that is, rising debt and rising interest rates, do not augur well for the developing countries. Such developments are stark warning for the advanced economies as well as for the international financial institutions that if the current debt situation in developing countries remained unattended or became victim of bloc politics or no meaningful efforts are made for the debt relief, there is a danger that the developing countries as a whole may see a protracted debt crisis leading to disorderly debt defaults.
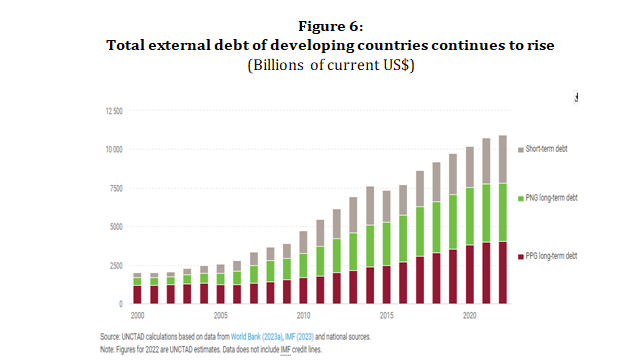
Thus far we have discussed public debt of the developing countries which has two components, that is, the local currency component and the foreign currency component. What is important for developing countries as well as for this paper is the foreign currency component of the public debt. The external debt stocks of developing countries have reached $11.4 trillion in 2023 which has more than doubled in the last one decade (See Figure 6).26 It has grown at an average annual rate of 7.6 percent since 2009, same as the annual growth rate in the decade prior to the global financial crisis (2000-2008). The total external debt stocks of developing countries excluding China, reached $8.9 trillion in 2023. 27 The composition of the external debt has also changed towards worse and as such has increased the risk of default. Short-term debt
25 UNCTAD (2024). 26 UNCTAD (2024), “Escalating Debt Challenges are Inhibiting Achievement of the SDGs”, (https”//sdgpulse.unctad.org/debt-sustainability/) SDG Pulse 2024, UNCTAD, Geneva. has grown at a faster pace than long-term in recent years. The short- term debt rose at an average rate of 8.3 percent per annum during 2009- 2023 as against 7.4 percent growth per annum growth of long-term external debt. Although the long-term external debt still accounts for 70.2 percent in developing increase, the share of short-term external debt nevertheless has increased from 23.8 percent in 2009 to 26.2 percent in 2023 (See Figure 6).28
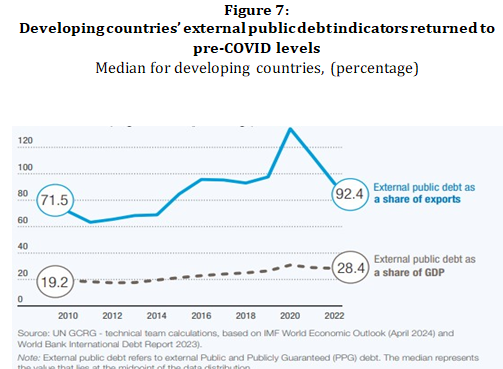
A rising external debt is not an issue for any country as long as they generate enough foreign exchange through export earnings to service its external debt payment obligations in an orderly manner. The burden of the debt of the developing countries has continued to rise in recent years. The ratio of external debt to exports increased from 71.5 percent in 2010 to 112 percent in 2021 but declined to 92.4 percent in 2022, that is, returned to the pre-Covid levels (See Figure 7). External debt as percent of GDP, continued to rise during the period. It was 19.2 percent of GDP in 2010 but increased to 28.4 percent by 2022 (See Figure 7).
In the midst of rising external debt burden, the high global interest rates have further compounded the difficulties of the developing countries. These developing countries spending far more on interest payment than on education and health. In 2010, developing countries, on average, were spending 5 percent of their budgetary revenues and 3.8 percent of their exports on external debt service. These ratios have increased to 8.8 percent and 6.3 percent, respectively in 2022 (See Figure 8).29
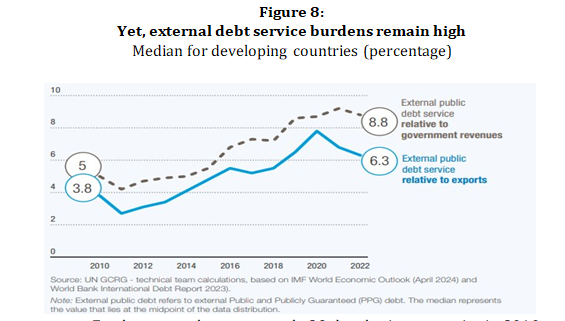
Furthermore, there were only 29 developing countries in 2010 who were spending more than 10 percent of their revenues on interest payment. Today, 54 developing countries are spending far more than 10 percent of their revenues on interest payment. Among them, at least 19 developing countries are spending more on interest payment than on education and 45 are spending more on interest payment than health. In total, 48 countries are home to 3.3 billion people, whose lives are directly affected by underinvestment in education and health as a result of large interest payment (See UNCTAD 2023).30 The rapid increase in interest payment is squeezing out spending in the key areas
29 Although these numbers are averages of the developing countries, there are many developing countries including Pakistan which are spending far more than these numbers on debt service payment. More on this issue later. 30 Pakistan is one of them. of social sector development, hence adversely impacting the quality of life of 3.3 billion people in developing countries.

As shown in Figure 9, the increase in interest payments during 2010-12 and 2020-22 were far greater than the increase in education and health. In developing countries, interest payments increased by 73 percent between 2010-12 to 2020-22 while spending on education and health registered an increase of 38 percent and 58 percent respectively
– far less than the increase in interest payments.31
31 See UNCTAD (2023).
Chapter IV: Debt Situation in Low-Income Countries
“Debt is like any other trap, easy enough to get into, but hard enough to get out”.
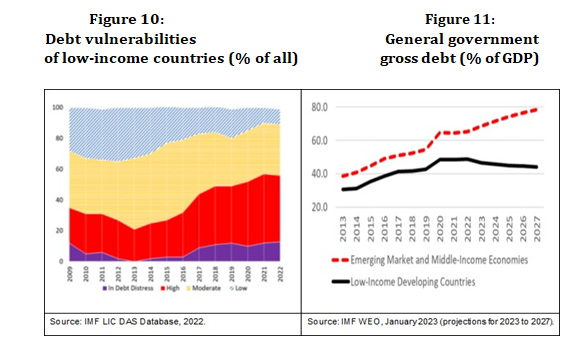
Henry Wheeler Shaw Within the developing countries, the Low-income countries (LICs) are facing a catastrophic debt crisis and therefore are the main focus of this paper. Around 50 percent of the 70 low-income countries in the world are either in debt distress or at high risk of it, hence it increases the urgency of debt relief (See Fig 10). These countries would require some $440 billion in additional financing for the period 2022- 26 to resume and accelerate their economic activities. Heavy debt repayment of these LICs is falling due in the next two years (2025 and 2026). These countries need to refinance about $60 billion external debt each year – about three times the average in the decade through 2020.32 Weaker global economic growth, persistence of higher global interest rates due to persistent inflationary pressure have pushed many LICs into fiscal, currency and debt crises.33 The average debt burden of countries in distress was a staggering 90 percent of GDP in 2019 but increased by almost 10 percentage points of GDP in 2021. These countries’ debts increased by an average of one percentage point of GDP per annum during 2010-19 but increased sharply by 13 percent points in 2020, owing mainly to meeting domestic Pandemic-related
32 See Holland and Pazarbasioglu (2024).
33 See Beirne et al (2023) and Khan (2023b).
expenditure requirements from both the domestic and external non- concessional sources (See Figure 11).
The countries in debt distress raised nearly half of their total public debt externally. In 2019, external public debt raised by the LICs totalled $34.0 billion, of which, about one-half was raised from multilateral institutions, one-third from bilateral creditors (pre- dominantly G-20 countries) and the remaining from the private sector. China was by far the single largest bilateral creditor, accounting for one-half of all the bilateral debt – extended by the G-20 countries. Naturally, all the three stakeholders are to be blamed for creating debt crisis in these LICs. While the debtor countries were reckless spenders, the creditors were equally reckless in providing credit or were throwing good money after bad money. The multilateral institutions also remained a silent spectator, not only provided money but failed to monitor the deteriorating debt sustainability situation. Hence, in the absence of a well – coordinated, globally accepted and predictable path towards debt relief, there is a very high probability of the breakout of
a cascading debt crisis that could derail the hard-won progress towards development.
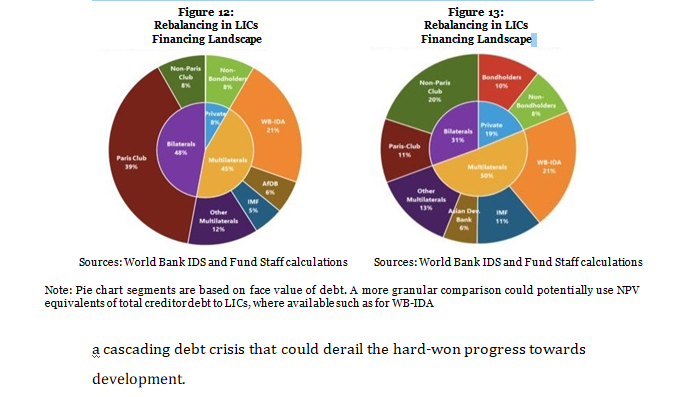
Why are these LICs facing catastrophic debt crisis today? The answer can be found in the changing composition of external debt of these LICs. Figures 12 and 13 document the changing composition of external debts of LICs. It can be seen from these figures that the composition or structure of external debts have undergone considerable changes during 1996 and 2021. The share of bilateral debt was nearly one-half (48%) in 1996 but declined to approximately one- third (31%) by 2021 – a decline of 7 percentage points. This decline was shared by multilateral (5-6%) and private creditors (11%).
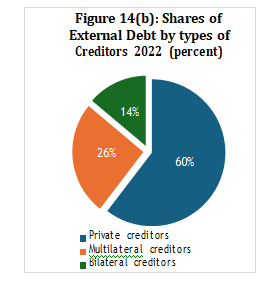
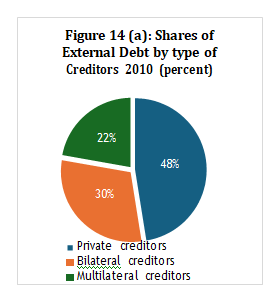
The share of multilateral institutions’ debt was 45% in 1996 but increased to 50 percent by 2021. Similarly, the share of private creditors (bond market and commercial banks) was 8 percent in 1996 but increased to 19 percent by 2021.34 In more recent years, the composition of the developing countries external debt (not the LIC’s alone) has also undergone significant changes. Private creditors were the most favoured lenders to developing countries with its share of 48 percent in 2010. Private creditors dominated as a lender to developing countries since then and its share increased to 60 percent by 2021 – a 12 percentage points increase in the share in one decade (See Figure 14a). Accordingly, the share of bilateral creditors declined from 22 percent to 14 percent and the share of multilateral creditors declined from 30 percent to 26 percent during 2010-2021 (See Figure 14b).35
Credit: Independent News Pakistan (INP)


