INP-WealthPk
Shams ul Nisa
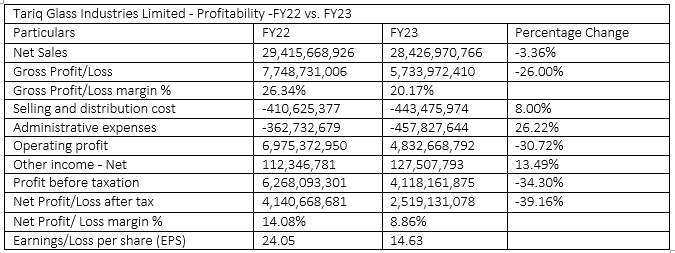
Tariq Glass Industries Limited (TGIL) saw its net sales fall to Rs28.4 billion during the fiscal year 2022-23, down 3.36% from sales of Rs29.4 billion in FY22. The company posted a profit-after-tax of Rs2.51 billion in FY23, which was 39.16% lower than Rs4.14 billion in FY22. Consequently, the net profit margin fell to 8.86% from 14.08% in FY22. TGIL’s gross profit stood at Rs5.73 billion in FY23 compared to Rs7.74 billion in FY22, posting a drop of 26% due to a decline in sales and an increase in cost of sales. Hence, the gross profit margin decreased from 26.34% in FY22 to 20.17% in FY23.

The selling and distribution costs of the company grew by 8% to Rs443.47 million in FY23 from Rs410.62 million in FY22. Similarly, administrative expenses increased to Rs457.8 million in FY23 from Rs362.7 million in FY22. Operating profits decreased to RsRs4.83 billion in FY23 from Rs6.97 billion in FY22, posting a decline of 30.72%. However, the company’s other income increased by 13.49% from Rs112.34 million in FY22 to Rs127.5 million in FY23. The profit-before-tax declined by 34.30% to Rs4.11 billion in FY23 from Rs6.26 billion in FY22. In FY23, the company’s earnings per share dropped to Rs14.63 from Rs24.05 in FY22.
Assets analysis
The non-current assets of TGIL decreased marginally from Rs14.20 billion in FY22 to Rs14.17 billion in FY23, showing a drop of 0.17%. With regard to current assets, the company reported a minor decrease of 2.01% from Rs8.79 billion in FY22 to Rs8.62 billion in FY23. Because of a decrease in both current and non-current assets, the total assets decreased by 0.87%. The company's total assets at the end of FY23 were recorded at Rs22.7 billion compared to Rs23 billion in FY22.
![]()
Equity and liabilities analysis
The company reported shareholder equity of Rs15.33 billion at the end of FY23, posting a 17.14% increase over Rs13.08 billion recorded at the end of FY22. Comparably, non-current liabilities decreased from Rs3.68 billion in FY22 to Rs2.83 billion in FY23. This shows that the company funded its operations entirely through its internal resources. The decline in total liabilities indicates the company's sound financial standing. From Rs6.23 billion in FY22 to Rs4.62 billion in FY23, current liabilities fell by 25.69%. This indicates that throughout this time, the company kept its expenses in check. Consequently, at the close of FY23, the company's total equity and liabilities stood at Rs22.79 billion compared to Rs23 billion in FY22, posting a minor decrease of 0.87%.

Cash flow analysis
In FY23, TGIL’s net cash generated from operating activities stood at Rs3.32 billion, down from Rs3.81 billion in FY22, showing a decrease of 12.94%. The company used Rs2.51 billion in cash to finance investing activities in FY22 compared to Rs1.08 billion in FY23, posting a decrease of 56.83%. The company used net cash of Rs1.30 billion in FY22 and Rs2.59 billion in FY23, respectively, for financing activities, representing an increase of 99.18% year-on-year. The amount of cash and cash equivalents at the end of the year decreased by 45.65% from Rs794.37 million in FY22 to Rs431.7 million in FY23.

Credit: INP-WealthPk


