INP-WealthPk
Shams ul Nisa
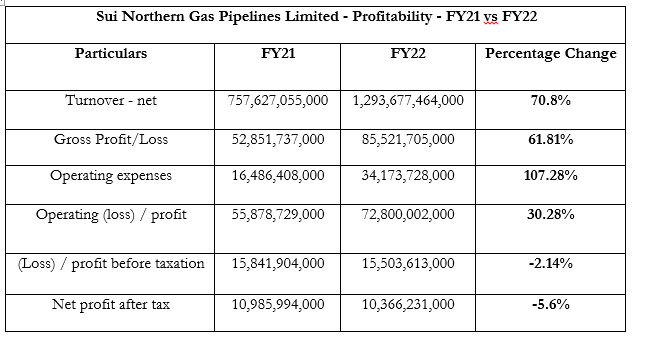
Sui Northern Gas Pipelines Limited (SNGPL) posted notable growth of 70.8% in net turnover in the financial year 2021-22 compared to the previous fiscal. This increase resulted in gross profit growth of 61.81% in FY22. During this period, the operating expenses grew by 107.28% to Rs34.1 billion from Rs16.48 billion in FY21 on the back of persistent inflation. Therefore, the operational profit of the company showed an adequate expansion of 30.28% from Rs55.87 billion in FY21 to Rs72.8 billion in FY22.
![]()
Despite the rise in revenue, gross and operational profit, the profit-before-taxation decreased marginally by 2.14% to Rs15.5 billion in FY22 from Rs15.8 billion in FY21. Additionally, the gas company’s net profit reduced from Rs10.98 billion in FY21 to Rs10.36 billion in FY22, constituting an overall decline of 5.6%. This decline can be attributed to the rise in operational costs and non-operating finance costs due to increased interest rates during the year and a decrease in the rate of return on assets. During the period under review, earnings per share decreased slightly to Rs16.34 from Rs17.32 in FY21.
Analysis of profit or loss over the years
From FY18 to FY22, SNGPL exhibited an overall upward trend in its revenue. In FY22, the net turnover, gross profit and operational profit were the highest. FY21 saw the highest profit-before-taxation of Rs15.8 billion, followed by Rs15.5 billion in FY22. The lowest pre-tax profit was recorded in FY20 at Rs8.4 billion.

SNGPL reported the highest profit-after-tax of Rs11.1 billion in FY18 and the lowest Rs5.9 billion in FY20. This shows that the company faced challenges in managing operational costs.
Statement of financial position
The share capital of SNGPL from FY18 to FY22 remained constant at Rs6.34 billion. Reserves of the company showed a gradual rise over the period from Rs12.3 billion in FY18 to Rs33.3 billion in FY22, reflecting a persistent accumulation of capital. Similarly, an increasing pattern was observed in property, plant and equipment, as it rose to Rs224.9 billion in FY22 from Rs190.6 billion in FY18. This surge indicates the gradual increase in the company’s investment in infrastructure.

However, the net current liabilities varied over the period, with least liabilities of Rs13.61 billion recorded in FY18 and maximum current liabilities of Rs32.12 billion in FY20. Long-term liabilities rose gradually over the period from Rs161.7 billion in FY18 to Rs199.6 billion in FY22.
Summary of cash flows
The company’s cash from operating activities decreased substantially from Rs39.58 billion in FY18 to Rs17.3 billion in FY19, but gradually increased in the subsequent years and reached Rs50.46 billion in FY22. During the period under review, the company invested in infrastructure development. The highest cash used for investing activities was Rs41.58 billion in FY18 and the lowest was Rs23.54 billion in FY20.

The company generated a net cash of Rs2.4 billion from financing activities in FY18, but observed a net cash outflow in the subsequent years. The optimum cash outflow of Rs14.9 billion was observed in FY19, whereas the least of Rs4.66 billion was recorded in FY21. This cash outflow for financing indicates the company used the cash for debt repayments during the years. The company recorded a net increase in cash and cash equivalent in FY18, FY20, FY21 and FY22 but a decrease of Rs25.42 billion in FY19.
Profitability ratios analysis
The gross profit ratio stood at 6.04% in FY18, but fell to 5.23% in 2019. It gained momentum and rose to the highest level of 8.78% in FY20, but declined slightly to 8.2% in FY21. The gross profit ratio remained at 7.94% in FY22. The net profit to sales ratio of 2.49% was the highest in FY18 and the lowest 0.96% in FY22.

Credit: INP-WealthPk


