INP-WealthPk
Shams ul Nisa
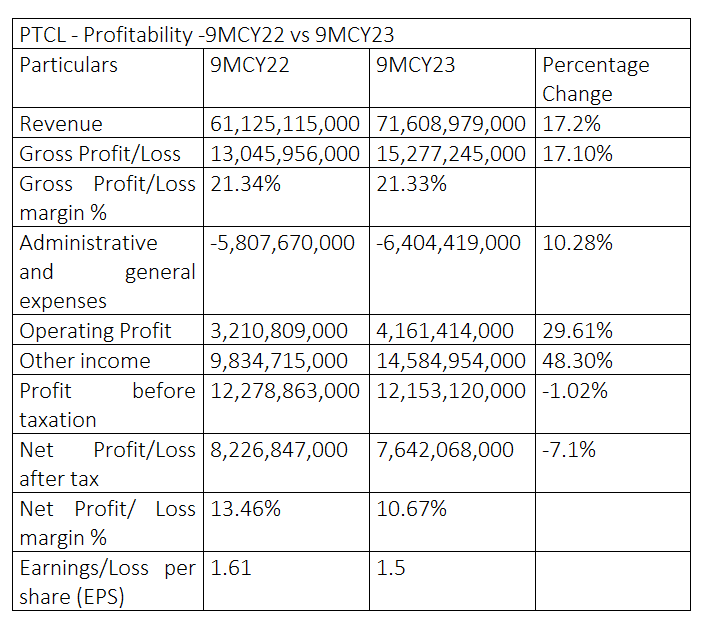
Pakistan Telecommunication Company Limited (PTCL) revenue increased by 17.2%, but the net profit dropped by 7.1% during the first nine months of the last calendar year 2023 compared to the corresponding period of the year earlier, according to WealthPK. The company attributed this increase in revenue to the growth in carrier and wholesale, enterprise and broadband segments during this period. At the end of 9MCY23, the company’s revenue stood at Rs71.6 billion and the net profit at Rs7.64 billion. The gross profit climbed to Rs15.27 billion in 9MCY23, up 17.10% from Rs13.04 billion in the same period the previous year. However, the gross profit margin showcased a decimal decline to 21.33% in 9MCY23 from 21.34% in 9MCY22. On the expenses front, administrative and general expenses expanded to Rs6.4 billion from Rs5.8 billion in 9MCY22, a rise of 10.28%.

However, the operating profit and other income grew significantly by 29.61% and 48.30% year over year to clock in at Rs4.16 billion and Rs14.58 billion, respectively, during the period under review. During 9MCY23 the company’s profit-before-tax dipped by 1.02% to Rs12.15 billion from Rs12.27 billion in 9MCY22. Similarly, the net profit margin dropped to 10.67% in 9MCY23 from 13.46% in 9MCY22. At the end of the period, earnings per share stood at Rs1.5 compared to Rs1.61 in 9MCY22.
3QCY22 vs 3QCY23
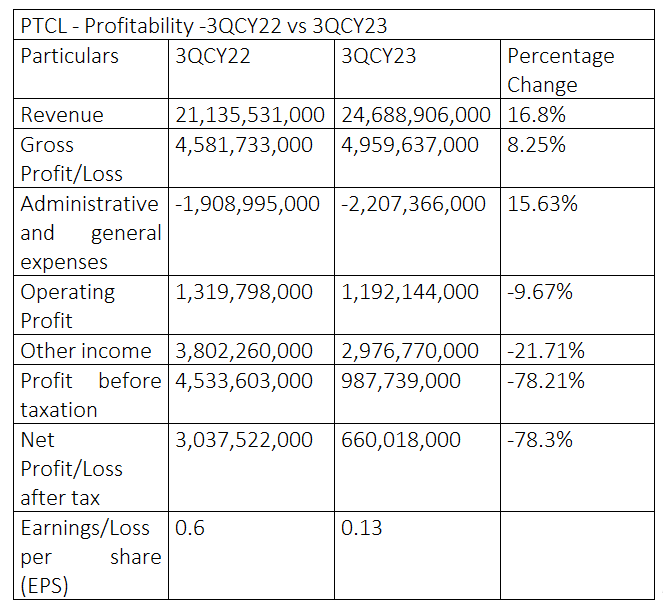
PTCL’s revenue improved by 16.8% and the gross profit by 8.25% to Rs24.68 billion and Rs4.95 billion, respectively, year-on-year in the first quarter of CY23. Similarly, administrative and general expenses expanded by 15.63% to Rs2.2 billion in 3QCY23 from Rs1.9 billion in 3QCY22.

The operating profit declined 9.67% to Rs1.19 billion from Rs1.3 billion previously. Likewise, other income and profit-before-tax fell by 21.71% and 78.21%, respectively, in 3QCY23. As a result, the net profit contracted by 78.3% to Rs660.01 million in 3QCY23 from Rs3.03 billion in 3QCY22.
Earnings per share dropped to Rs0.13 from Rs0.6.
Valuation and liquidity position analysis
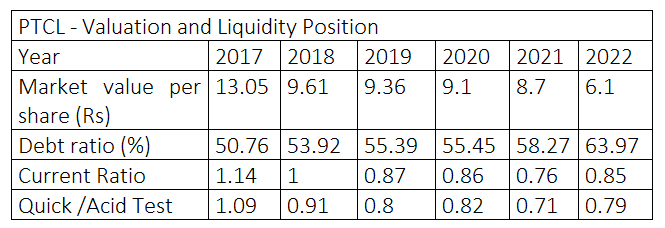
The historical analysis of market value per share showed a declining trend from 2017 to 2022. PTCL registered the highest market value per share of Rs13.05 in 2017 and the lowest of Rs6.1 in 2022.
The debt ratio, which measures the total liabilities in relation to total assets, remained below 100%, indicating the company had more assets than debt. A debt ratio greater than 100% means a company has a high risk of not paying its liabilities. PTCL’s current ratio was under 1.2 in these years, indicating the company had less ability to meet its obligations with current assets.

Similarly, the quick ratio remained below 1 from 2018 to 2022, showing the company lacked quick assets to cover its short-term obligations. The company posted a quick ratio of 1.09 in 2017.
Credit: INP-WealthPk


