INP-WealthPk
Shams ul Nisa
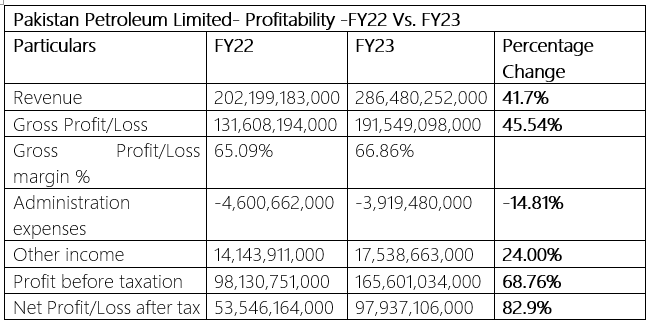
Pakistan Petroleum Limited (PPL) posted a profit of Rs97.9 billion in FY2023, an 82.9% increase from Rs53.54 billion in the previous year, even after paying super tax, according to WealthPK. The company's revenue increased to Rs286.48 billion in FY23, up 41.7% compared to Rs202.19 billion recorded in the same period last year. The company attributed this rise to favorable exchange rate variance over the year. Similarly, the gross profit expanded by 45.54% to Rs191.54 billion in FY23 from Rs131.6 billion in FY22. Gross profit margin inched up slightly to 66.86% in FY23 compared to 65.09% in FY22.

![]()
However, the company effectively managed its expenses, as administrative expenses contracted by 14.81% reaching Rs3.919 billion in FY23. Other income increased due to higher interest rates from Rs14.14 billion in FY22 to Rs17.53 billion in FY23, registering a growth of 24.00%. During FY23, the profit before tax clocked in at Rs165.6 billion, up by 68.76% from Rs98.13 billion in the same period last year. The company’s net profit margin grew significantly from 26.48% in FY22 to 34.19% during the period under review due to lower administrative expenses and a controlled increase in operating expenses. Earnings per share of the company came in at Rs35.99 in FY23, compared to Rs19.68 last year.
Historical Trend Analysis
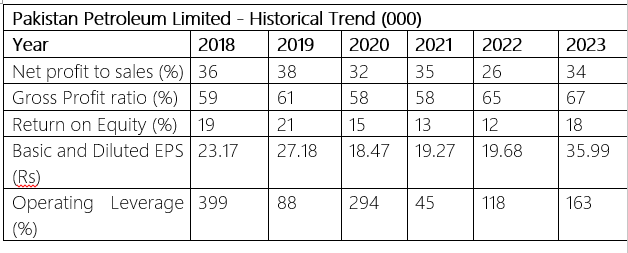
From 2018 to 2023, the net profit to sales ratio remained volatile ranging between the highest of 38% in 2019 to the lowest of 26% in 2022. In 2023, the oil and gas exploration company declared a net profit-to-sales ratio of 34%. The gross profit ratio remained above 50%, which shows a stable profit generation by the company after accounting for the cost of the sales. Starting from 59% in 2018, the gross profit ratio reached 67% in 2023, varying in between the years. Return on Equity shows the ability of the company to generate profit by efficiently utilizing the shareholder's equity financing. Return on Equity has decreased in recent years to 18% in 2023 from 19% in 2018. The company recorded a maximum return on equity ratio of 21% in 2019 and a minimum of 12% in 2022.

Earnings per share increased from 23.17 in 2018 to 27.18 in 2019, followed by a dip of 18.47 in 2020. In later years, it climbed to the highest of 35.99 in 2023. Operating leverage measures how well a company generates operating income by increasing revenue. The company’s operating leverage decreased in recent years to 163% compared to 399% in 2018. Whereas, the company witnessed the lowest of 45% in 2021.
Liquidity Ratio Analysis


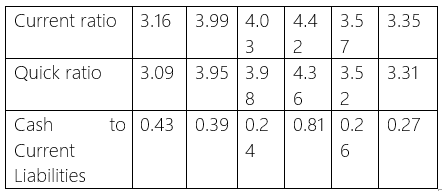
The current ratio estimates a company's ability to use its current assets to cover its short-term obligations. The company's risk of covering its short-term obligations increases if the ratio lies below 1.2, while a ratio between 1.2 and 2 and above is typically considered safe. The current ratio has been consistently above 1 over the years, showing that the company has a low risk of defaulting on its liabilities. The ratio reached its peak of 4.42 in 2021 and its lowest point of 3.16 in 2018. The quick ratio also shows that the company has a strong ability to meet its obligations, as it has stayed above 1 throughout the years. However, the company does not have enough cash to pay off its current liabilities, as the cash-to-current liability ratio has been below 1 from 2018 to 2023. The highest value of this ratio was 0.81 in 2021.
Credit: INP-WealthPk


