INP-WealthPk
Fakiha Tariq
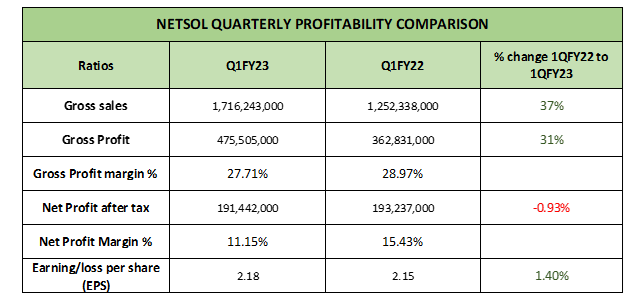
ISLAMABAD, Dec 14 (INP-WealthPK): NETSOL Technologies Limited (NETSOL) registered the highest earnings per share value of Rs2.18 in the first quarter (Jul to Sept) of fiscal 23 from the last five corresponding quarters of the previous years, reports WealthPK. In comparison with the same quarter last year, NETSOL revenues and profits considerably escalated in 1QFY23.
Listed in the technology and communication sector on the PSX, NETSOL Technologies is the sixth largest company as per the market capitalisation of Rs9.4 billion. Mainly engaged in the development and sale of computer software, NETSOL provides a range of IT solutions and services to its customers both at national and international level. The company reported gross sales of Rs1.7 billion in the 1QFY23. Gross profit and net profit of 27.71 % and 11.15% was earned in the first quarter of fiscal 23.

In comparison to 1QFY22, NETSOL increased its gross sales by 37% in 1QFY23. Gross profit value also piled up from Rs362 million to Rs475 million. Gross profit increased by 31% in value from 1QFY22 to 1QFY23. The earning per share value in 1QFY23 increased to Rs2.18 per share from the reported EPS value of Rs2.15 per share in the same quarter of the previous year.
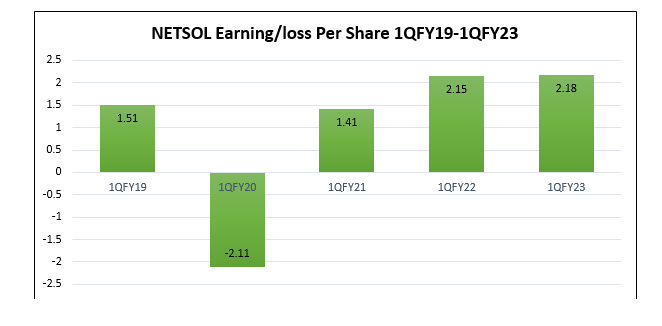
NETSOL Earnings per share – 1QFY19-1QFY23
When observed for the corresponding quarters of the last four fiscal years (FY19 to FY 23), NETSOL registered the highest earnings per share value of Rs2.18 in the 1QFY23.

In the last four years, NETSOL reported the loss per share only for once in 1QFY20. Followed by that dip of EPS value in 1QFY20, NETSOL EPS value is continuously growing to date.
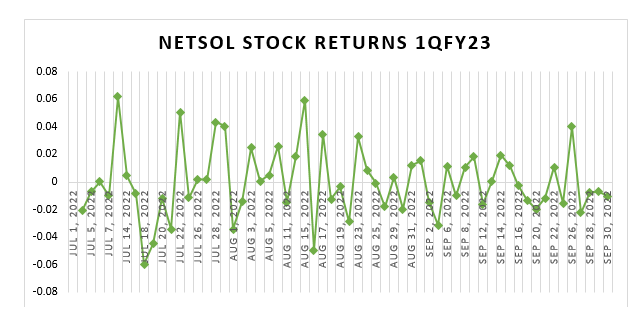
NETSOL Stock Returns – 1QFY23 vs 1QFY22
NETSOL stock returns for 1QFY23 showed a favourable mix of multiple spikes and dips of returns generated via trading. On average, the NETSOL stock added the loss of 0.027% in its shareholders portfolio in 1QFY23.

In comparison to the corresponding quarter of previous fiscal 22, average loss experienced by NETSOL stocks in 1QFY23 was less. In 1QFY22, average quarterly loss reported was 0.51%. The stock returns with maximum deep dips can also be observed when graphed for 1QFY22.

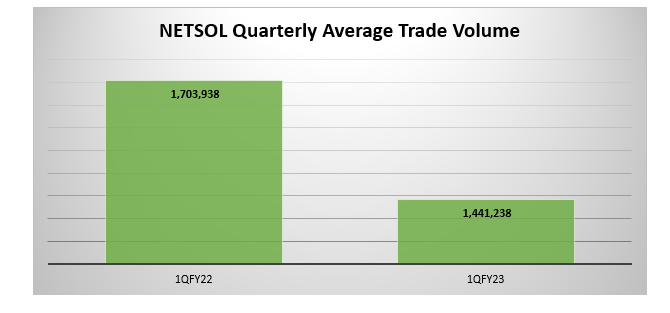
NETSOL Trade Volume – 1QFY23 vs 1QFY22
For NETSOL Technologies, in 1QFY23, the average no. of shares traded was reported to be 1,441,238.

NETSOL has experienced a decline of 15% in the trade volume of stocks from 1QFY22 to 1QFY23.
Credit : Independent News Pakistan-WealthPk


