INP-WealthPk
Shams ul Nisa
The annual financial report of Mari Petroleum Company Limited shows tremendous growth in sales, gross and net profits during the last fiscal year 2022-23 compared to the preceding 2021-22 fiscal. The company’s sales increased by 49.7% in FY23 compared to FY22. During the same period, the gross and net profits had a massive growth of 53.2% and 69.8%, respectively. The company’s sales rose to Rs163.1 billion in FY23 from Rs108.9 billion in FY22. This massive rise in sales indicates that the company’s core revenue-generating activities have increased substantially.
The gross profit soared to Rs145.7 billion in FY23 from Rs95.1 billion in FY22. Furthermore, the company’s gross profit margin also showed a slight upswing from 87.30% in FY22 to 89.34% in FY23, reflecting the firm’s capacity to productively manage and control its manufacturing expenses and generate an ample profit on per unit sales.
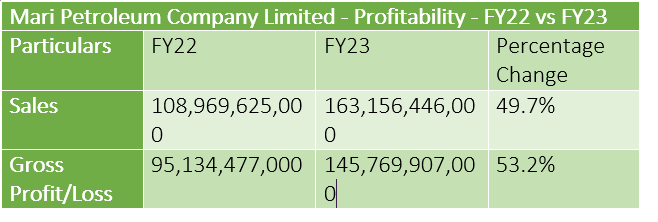
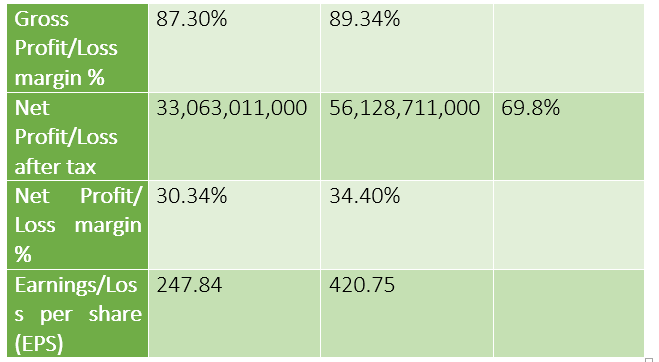
The most robust growth was observed in net profit of the company as it massively hiked to Rs56.1 billion in FY23 as compared to Rs33 billion in FY22. This exceptional rise shows the company’s advanced capacity to generate high profits after accounting for all expenditures and taxes. The net profit margin climbed from 30.34% in FY22 to 34.40% in FY23. This increase indicates Mari Petroleum was successful in retaining major part of its revenues as net profit. The earnings per share (EPS) experienced a gigantic spike from Rs247.84 in FY22 to Rs420.75 in FY23. This signals an appreciable rise in the earnings on the outstanding shares of the company’s stock.
Analysis of last four years financials
Mari Petroleum Company Limited’s financial data for the last four fiscal years, from FY19 to FY22, provides insight into the company’s sales, profitability and earnings per share. The company’s sales exhibited an increasing trend from FY19 to FY22. The sales were recorded at Rs72 billion, Rs73 billion, Rs95 billion and Rs145 billion in FY19, FY20, FY21 and FY22, respectively. This shows the company’s ability to generate massive revenue by tactfully cashing in on the market opportunities.
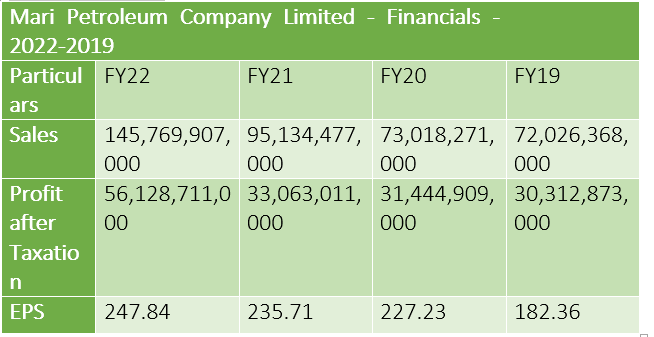
The company also experienced a remarkable growth in terms of profit-after-taxation, as it rose from Rs30 billion in FY19 to Rs56 billion in FY22, depicting the company’s exceptional ability to raise higher profits after incurring all expenditures and taxes.
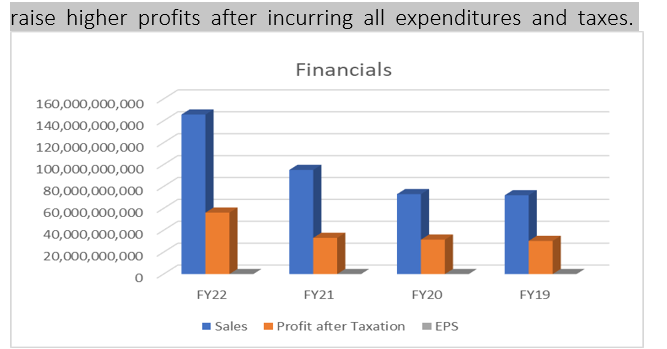
The earnings per share also showed an upward swing from FY19 to FY22. The EPS was recorded at Rs182.36, Rs227.23, Rs235.71 and Rs247.84 in FY19, FY20, FY21 and FY22, respectively. This signifies high per share profit on each share held by the company’s shareholders.
Analysis of last four years ratios
During the last four years, the company posted the double-digit gross profit ratios as they were recorded at 87.77%, 87.24%, 87.39% and 87.96% in FY19, FY20, FY21 and FY22, respectively. A minute change in gross profit ratio over the course of four years suggests the company was able to efficiently attain high gross profit relative to its sales.

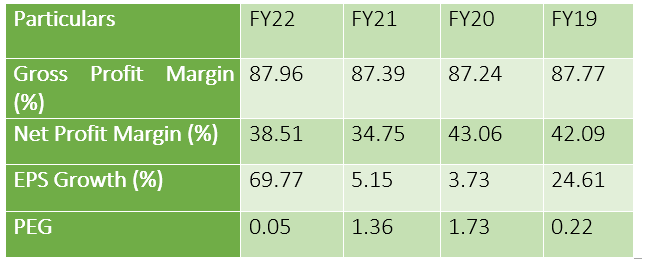
The net profit margin showed a fluctuating trend over the course of four years. The company posted the highest net profit margin of 43.06% in FY20, followed by 42.09% in FY19, 38.51% in FY22 and 34.75% in FY21. This can be attributed to the change in policy rate and increased inflation.
The company’s earnings per share growth percentage stood at 24.61%, 3.73%, 5.15% and 69.77% in FY19, FY20, FY21 and FY22, respectively. Mari Petroleum’s price/earnings to growth ratio (PEG) exhibited a steady trend over the time period. The highest PEG was recorded at 1.73 in FY20, and the lowest at 0.05 in FY22. PEG was recorded at 1.36 in FY21 and 0.22 in FY19.
Company profile
Mari Petroleum is a public limited company founded in Pakistan on December 4, 1984. It is the second largest hydrocarbon producer in Pakistan, with a 23% market share. It produces 100,000 barrels of oil equivalent hydrocarbon per day.
Credit: INP-WealthPk


