INP-WealthPk
Hifsa Raja
Lucky Core Industries Limited earned a record Rs18.9 billion profit in the third quarter of the last fiscal year 2022-23, jumping massively from the second quarter profit of only Rs1.2 billion. In the third quarter, Lucky Core Industries Limited successfully sold 21,763,125 ordinary shares of NutriCo Morinaga Private Limited (NMPL) to Morinaga Milk Industry Co. Ltd, Japan (Morinaga Milk). This sale, worth $45 million, amounted to approximately 26.5% of the total shares of NMPL. As a result of this transaction, the company recorded a gain of Rs9.8 billion in its standalone financial statements.
And this is the reason for the huge surge in net profit gain in the third quarter of FY23. Lucky Core Industries now retains around 24.5% ofNMPL’sownership, making it an associated company with significant influence over its operations and financials. In the first quarter (July-Sept) of FY23, the company posted sales of Rs24billion, and earned gross profit of Rs4.9billion and net profit of Rs1.8billion over them.


The company in the second quarter (Oct-Dec) posted income of Rs25billion,gross profit of Rs4billion and net profit of Rs1.2billion. In the third quarter (Jan-March), the company posted income of Rs30.8billion,gross income of Rs7billion and record net profit of Rs18.9billion. The financial results of Lucky Core Industries Limited for the first three quarters of FY23 show the firm had steady increase in sales across the three quarters.
Though it had a dip in net profit during the second quarter, the company showed resilience by rebounding and achieving much higher profits the following quarter.

Lucky Core Industries' strong performance in both gross revenue and net profit has positioned it as a key player in the industry and reinforced its ability to deliver value to its shareholders. With a solid foundation and a strategic approach, the company is well-positioned to maintain its growth momentum and navigate future market challenges.
Performance in FY22
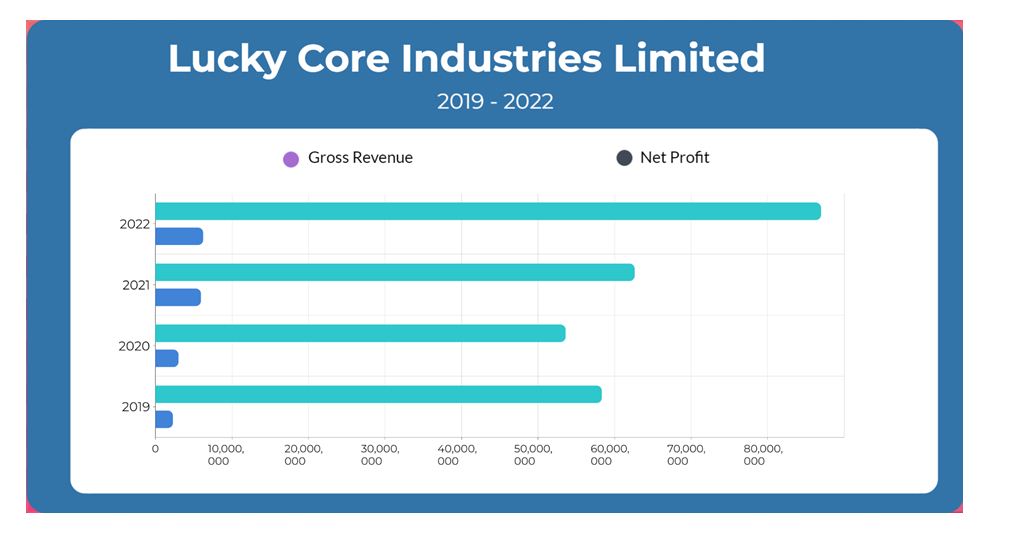
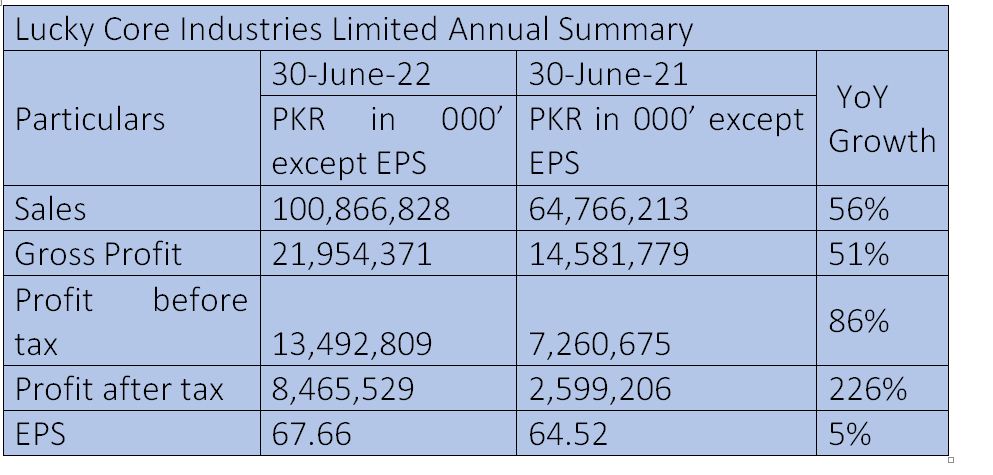
In the fiscal year 2021-22, the company reported an increase in net sales revenue, reaching Rs100billion compared to Rs64billion in the previous year, registering a healthy growth of 56%. The gross profitalso increased, standing at Rs21billion, up 51% from the previous year's Rs14billion.

The company’s profit-before-taxincreased to Rs13billion in FY22, surpassing the previous year's Rs7billion. Moreover, the post-tax profit flew to Rs8billion in FY22 from the previous year's Rs2.5billion, posting a striking 226% growth.
Earnings per share
In 2019, the earnings per share was Rs24.96, which increased to Rs32.8, Rs64.52, and Rs67.66 in 2020, 2021, and 2022, respectively. Except the negative EPS growth in 2019, such growth remained positive in the later years.

Ratio analysis
The company's profitability, including gross, net and operating profit margins, demonstrate its ability to generate healthy returns on its operations.

In the first quarter of FY23, Lucky Core Industries achieved a gross profit margin of 20.28%. This indicates that the company was able to effectively manage its production costs and maintain a reasonable profit margin on its sales. Similarly, the net profit margin stood at 7.41% during this quarter, highlighting the company's ability to generate net income after considering all expenses, including taxes and interest payments. This indicates efficient cost control and effective utilisation of resources. Moreover, the operating profit margin of 12.9% during the first quarter showcases the company's ability to generate profits from its core operations.
This measure reflects Lucky Core Industries' operational efficiency and effectiveness in managing its operating expenses. Looking at the six-month performance (6MFY23), Lucky Core Industries maintained its strong profitability. The gross profit margin was 18.19%, indicating sustained control over production costs. The net profit margin stood at 6.1%, demonstrating the company's ability to convert its revenue into net income. The operating profit margin was 10.81%, showcasing continued profitability from its core operations. As Lucky Core Industries reached the nine-month mark (9MFY23), its profitability further improved. The gross profit margin rose to 20.04%, indicating effective cost management and potential economies of scale. The net profit margin significantly increased to 27.3%, reflecting higher net income generated during the period.
The operating profit margin also showed improvement, reaching 13.07%, indicating enhanced operational efficiency. Overall, the ratio analysis demonstrates the company’s strong profitability and its ability to generate consistent returns. The company's efficient cost management, effective utilisation of resources, and focus on operational excellence contributed to its impressive profitability ratios. These measures indicate a financially stable and successful organisation that is well-positioned for sustainable growth. Lucky Core Industries’ continued commitment to maintaining profitability, along with its focus on innovation and customer satisfaction, has positioned the company for further success. As it continues to capitalise on market opportunities and optimise its operations, it is poised to deliver value to its stakeholders and sustain its financial performance in the future.
Industry comparison
Lucky Core Industries Limited’s competitors include Dynea Pakistan Limited, Wah Nobel Chemicals Limited, Fatima Fertilizer Company Limited, andDawood Hercules Corporation Limited.

Lucky Core Industries Limitedhas the highest market capitalisation of ₨59.9billion followed byFatima Fertilizer Company Limited’s₨58.7billion and Dawood Hercules Corporation Limited’sRs47.6billion. Wah Nobel Chemicals Limited has the lowest market value of ₨1.5 billion.
Company profile
Lucky Core Industries Limited is publicly listed engaged in five diverse businesses: polyester, soda ash, chemicals &agri sciences, pharmaceuticals and animal health. Through these businesses, the company manufactures and trades in a wide range of products, including polyester staple fiber, soda ash, general and specialty chemicals, pharmaceuticals, nutraceuticals, animal health products and agricultural products (including chemicals, field crop seeds, vegetable seeds and more).
Credit: INP-WealthPk


