INP-WealthPk
Shams ul Nisa
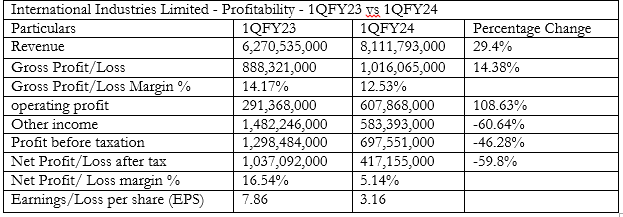
International Industries Limited (INIL) reported healthy revenue generation, but its profitability reduced significantly in the first quarter (July-September) of the ongoing fiscal year 2023-24 (1QFY24) compared to the same period of the previous fiscal year. During 1QFY24, Pakistan’s largest manufacturer of steel and polymer pipes hit revenue of Rs8.11 billion, 29.4% greater than Rs6.27 billion in 1QFY23, mainly because of the expansion in the domestic market. Another factor that led to a rise in revenue was the remarkable growth in the polymer division. However, the net profit reduced 59.8% to Rs417.15 million from Rs1.037 billion in 1QFY23. The company’s gross profit grew 14.38% to Rs1.016 billion in 1QFY24 from Rs888.32 million in the same period last year.

However, the gross profit margin slipped to 12.53% in 1QFY24 from 14.17% in 1QFY23 due to increased costs of production. The company observed an exceptional hike of 108.63% in operating profit, which jumped to Rs607.86 million from Rs291.36 million in 1QFY23. During 1QFY24, other income plunged by 60.64% and profit-before-tax by 46.28%. As a result, the net profit margin dropped to 5.14% in 1QFY24 from 16.54% in 1QFY23. Similarly, the EPS dropped to Rs3.16 in 1QFY24 from Rs7.86 in 1QFY23.
Financial position analysis

![]()
The company's non-current assets grew 9.62% from Rs12.31 billion in June 2023 to Rs13.49 billion in September 2023. This increase in non-current assets shows the company expanded its operations to secure its financial position in the market.
However, the current assets fell to Rs15.937 billion in September 2023 from Rs20.64 billion in June 2023.
Total shareholders’ equity slightly increased 0.86% to Rs15.38 billion in September 2023 from Rs15.24 billion in June 2023.
The company’s non-current and current liabilities decreased by 3.26% and 31.31%, respectively, during the period under review. At the end of the quarter, the total equity and liabilities stood at Rs29.43 billion, 13.32% lower than Rs33.95 billion in June 2023.
Historical trend

INIL has shown persistent growth in its net sales from Rs18.96 billion in FY20 to the highest of Rs37.85 billion in FY22. However, its sales went down to Rs26.78 billion in FY23. During FY20, the company posted a net loss of Rs694 million due to a slowdown in economic activity caused by the Covid-19-induced lockdowns. In FY21, however, the net profit increased to Rs2.31 billion as a result of better market circumstances. However, the net profit in FY22 slightly decreased to Rs2.15 billion, but marginally increased to Rs2.27 billion in FY23.
This shows that the company was able to control expenses. In 2021, INIL posted the highest gross profit margin of 13.73% and the lowest of 7.23% in 2020. The company witnessed an improvement in net profit margin from negative growth of 3.66% in 2020 to the highest of 8.49% in 2023. During 2020 and 2022, the company’s EPS growth remained negative, standing at -144.05%, and 6.84%, respectively. In 2021 and 2023, the company registered a positive EPS growth of 433.05% and 5.38%.
Credit: INP-WealthPk


