INP-WealthPk
Shams ul Nisa
Ibrahim Fibres Limited recently released its financial report for the half-year and second quarter ending on June 30, 2023, posting a decline in both revenue and profitability because of the substantial slowdown in domestic economic activity. The company reported total revenue of Rs60.1 billion during the half-year period compared to Rs64.1 billion over the corresponding period last year, reflecting an overall downfall of 6.3%. This decrease in revenue is attributed to the prevailing economic uncertainties mainly because of the persistent high inflation, deteriorating foreign exchange reserves and significant depreciation of Pakistani rupee against the US dollar.
As a result of the fall in revenue, the company’s gross profit also faced challenges. The gross profit was compressed by 44.66% to Rs6.69 billion in 1HCY23 from Rs12.09 billion in 1HCY22. This can be attributed to the rise in the cost of goods sold by the company. Likewise, the gross profit margin stood at 11.14% in 1HCY23 compared to 18.87% in 1HCY22. This fall in gross profit indicated that the company was unable to use its resources to earn high gross profit to finance its high administrative costs.

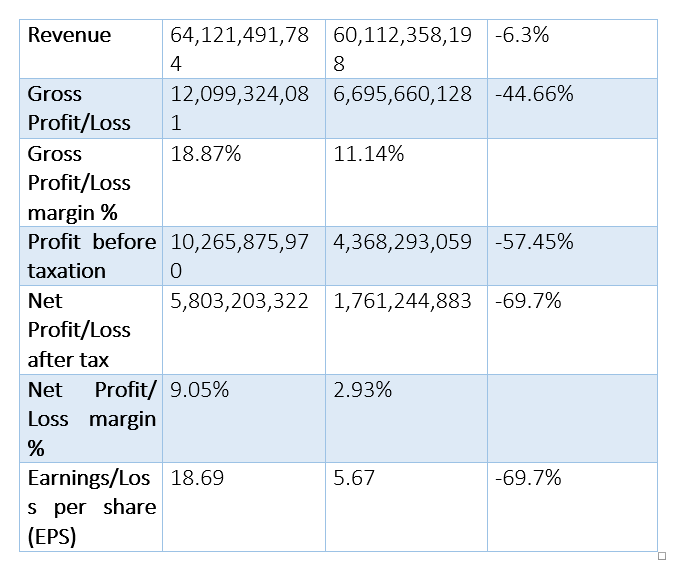
The profit-before-tax significantly decreased by 57.45% to Rs4.36 billion in 1HCY23 from Rs10.2 billion in 1HCY22. This decline is attributed to the increase in operating costs of the company and uncertain market conditions. Similarly, Ibrahim Fibres’ net profitability declined by 69.7% during the half-year period to Rs1.76 billion from Rs5.80 billion in 1HCY22. This fall in revenue, gross and net profitability reflects the challenges faced by the company during the half-year period of the ongoing year.
The company’s net profit margin also dwindled to 2.93% in 1HCY23 from 9.05% in 1HCY22. The downfall in the net profit margin is because of the high-interest rate, elevated power tariff and domestic currency devaluation. The earnings per share (EPS) of the company fell by 69.7% to Rs5.67 in 1HCY23 from Rs18.69 in 1HCY22. This decline indicated the decrease in profitability per share that caused the stocks to be less attractive to investors.
Second quarter analysis
During the second quarter ending on June 30, 2023, Ibrahim Fibres faced challenges in generating revenue, gross and net profits. The revenue dropped 9.2% to Rs30.39 billion in 2QCY23 from Rs33.46 billion in 2QCY22. This can be attributed to a number of factors, such as market conditions, changes in consumer behaviour or macroeconomic uncertainties. The company’s gross profit decreased by 44.2% to Rs3.28 billion in 2QCY23 from Rs5.88 billion in 2QCY22. Similarly, gross profit margin dropped to 10.80% in 2QCY23 from 17.58% in 2QCY22. This decline in both gross profit and margin indicates the rise in cost of production relative to revenue generated by the goods sold, which can be because of supply chain disruptions or pricing pressures.

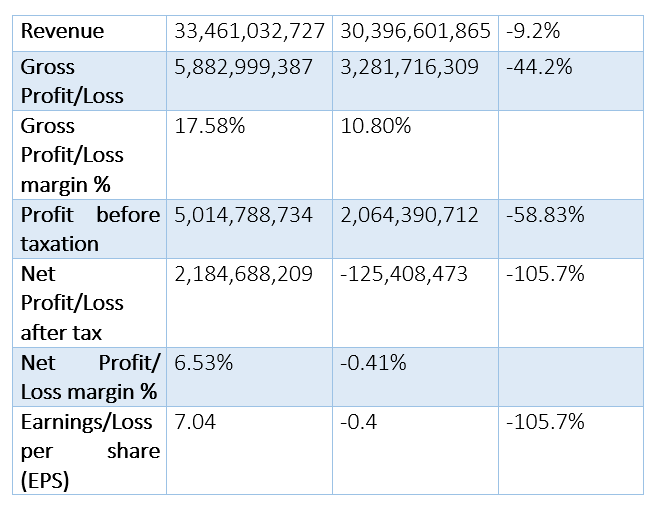
During the period under consideration, the profit-before-tax was recorded at Rs2.06 billion against Rs5.01 billion in 2QCY22, resulting in an overall downfall of 58.83%. The company experienced a robust net loss of Rs125.4 million in 2QCY23 against a net profit of Rs2.18 billion in 2QCY22, posting a 105.7% decrease in profitability. The company recorded a net loss margin of 0.41% in 2QCY23 against the net profit margin of 6.53% in 2QCY22. The company faced challenges because of volatile crude oil prices that added to the existing uncertain economic environment. The EPS fell by 105.7% in 2QCY23 as the company experienced a loss per share of Rs0.4 compared to earnings per share of Rs7.04 over the same quarter last year.
Assets analysis
Despite the financial challenges faced by the company, the non-current asset moderately increased by 4.21% to Rs40.5 billion on June 30, 2023, from Rs38.8 billion on December 31, 2022. This suggests that the company has invested in long-term assets such as property, equipment and intangible assets.
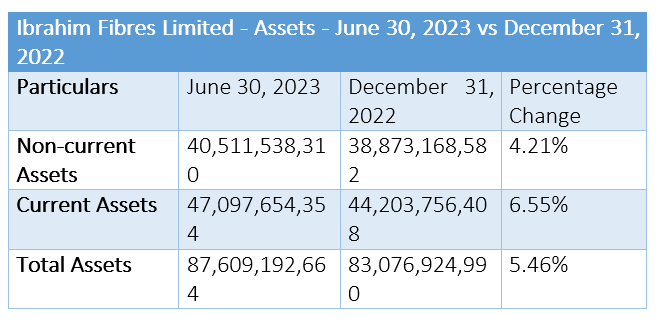
The current assets grew 6.55% from Rs44.2 billion on December 31, 2022, to Rs47.09 billion on June 30, 2023. This shows the increase in short-term assets such as cash, account receivables and inventory. The rise in current and non-current assets resulted in growth of 5.46% in total assets as the company’s total assets rose to Rs87.6 billion as of June 30, 2023, from Rs83.07 billion on December 31, 2022.
Equity and liabilities analysis
As of June 30, 2023, the company’s non-current liabilities were Rs12.5 billion compared to Rs10.04 billion on December 31, 2022, reflecting a growth of 25.18%. This signifies that the company has taken more long-term obligations to finance the capital investments and other expenses.
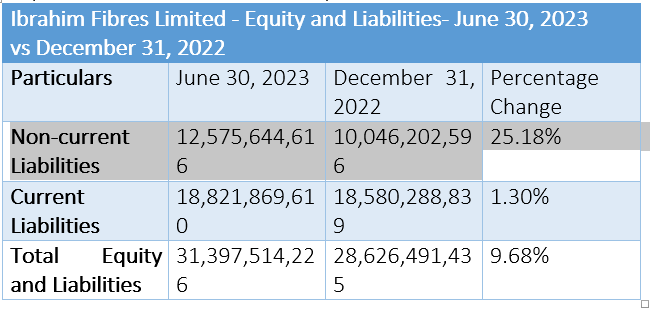
The company’s current liabilities rose slightly by 1.30% to Rs18.8 billion on June 30, 2023, from Rs18.5 billion on December 31, 2022. Short-term obligations include short-term loans, accounts payables and other current liabilities. Ibrahim Fibres’ total equity and liabilities grew by 9.68% during the period under consideration.
Credit: INP-WealthPk


