INP-WealthPk
Shams ul Nisa
Ghandhara Industries Limited’s sales plunged 28.2% to Rs12.7 billion in the first nine months of the previous fiscal year 2022-23 from Rs17.7 billion over the same period of FY22 due to a substantial fall in the sales of trucks and buses, WealthPK reports. The company’s gross profit also fell 35.3% to Rs1.7 billion in 9MFY23 from Rs2.7 billion in 9MFY22. The gross profit margin dropped from 15.55% in 9MFY22 to 14.02% in 9MFY23. This means the company’s profitability decreased due to rising inflation.
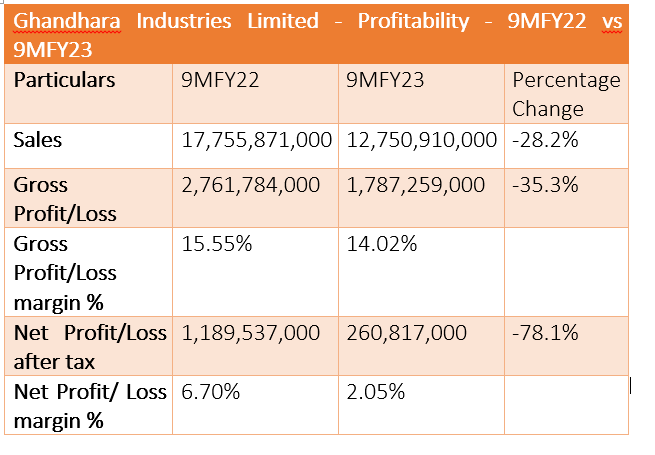

Likewise, the net profit dipped a considerable 78.1% to Rs260 million in 9MFY23 from Rs1.18 billion in 9MFY22. Consequently, the net profit margin plunged from 6.07% in 9MFY22 to 2.05% in 9MFY23, showing high expenses and taxes borne by the company. The company’s earnings per share (EPS) dropped significantly to Rs6.12 in 9MFY23 from Rs27.92 in 9MFY22. Overall, the company’s financial performance in 9MFY23 faced a downfall in sales, gross profit, net profit and EPS.
3QFY23 compared with 3QFY22
Ghandhara Industries Limited’s sales fell 22.2% to Rs4.8 billion in 3QFY23 from Rs6.1 billion in 3QFY22. The drop in sales can be attributed to prolonged political and economic uncertainties, contractionary monetary policy and supply chain disruptions in the country. The gross profit in 3QFY23 also decreased 14.5% to Rs719 million from Rs840 million in 3QFY22. Despite declining gross profit, the gross profit margin increased to 14.98% in 3QFY23 from 13.62% in 3QFY22. This shows that the company effectively managed its production expenditure relative to sales.

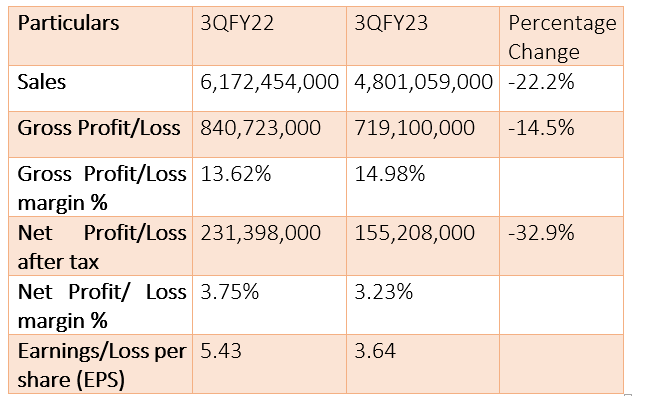
The company’s net profit dropped 32.9% to Rs155 million in 3QFY23 from Rs231 million in 3QFY22. Likewise, the net profit margin decreased to 3.23% in the quarter under consideration from 3.75% last year. This can be attributed to a decline in revenue and high production costs because of high inflation. Similarly, the EPS fell to Rs3.64 in 3QFY23 from Rs5.43 in 3QFY22.
Income Statement Analysis
The company’s direct cost of producing goods decreased from Rs14.9 billion in 9MFY22 to Rs10.9 billion in 9MFY23. This shows the company followed an effective cost management policy. Regardless of cost management, the gross profit plunged to Rs1.7 billion in 9MFY23 from Rs2.7 billion last year, thus decreasing sales by 14% in 9MFY23 compared to 16% in 9MFY22. This indicates the reduction in revenue surpassed the fall in the cost of production, resulting in a drop in gross profit.
The company’s distribution cost fell to Rs610 million compared to Rs669 million the previous year, thus reducing sales by 5% in 9MFY23. Furthermore, the administrative expenditure increased to Rs276 million in 9MFY23 from Rs254 million in 9MFY22, thus decreasing sales by 2% in 9MFY23.
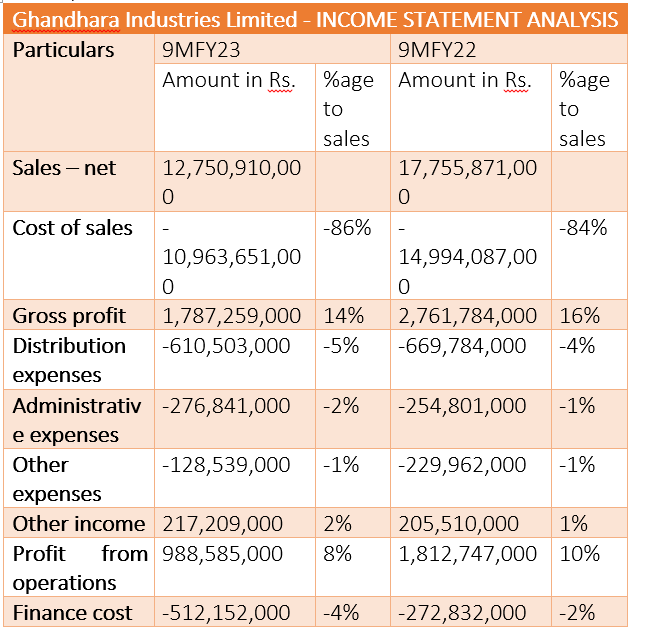

Other expenses reduced sales by the same percentage point of 1% in 9MFY23 compared to 9MFY22, as these expenses fell to Rs128 million in 9MFY23 from Rs229 million in 9MFY22. The company’s other income rose by 2% in 9MFY23 compared to 1% in 9MFY22. This can be attributed to an increase in income from non-core activities in FY23. On the other hand, the profit from operations fell from Rs1.8 billion in 9MFY22 to Rs988 million in 9MFY23, resulting in a decline in sale of 8% in 9MFY23 compared to 10% in 9MFY22.
This can be attributed to the company’s low profit generation from its core activities. The finance cost increased to Rs512 million in 9MFY23 from Rs272 million in 9MFY22, thus reducing sales by 4% compared to 2% previously. Similarly, the profit-after-taxation increased sales by 2% in 9MFY23 compared to 7% in 9MFY22.
Total Assets Analysis
The Ghandhara Industries Limited’s non-current assets slightly decreased by 0.11% in March 2023 compared to June 2022. The non-current assets fell from Rs4.396 billion in June 2022 to Rs4.391 billion in March 2023. The slight decrease indicates that the company was relatively stable between June 2022 and March 2023.
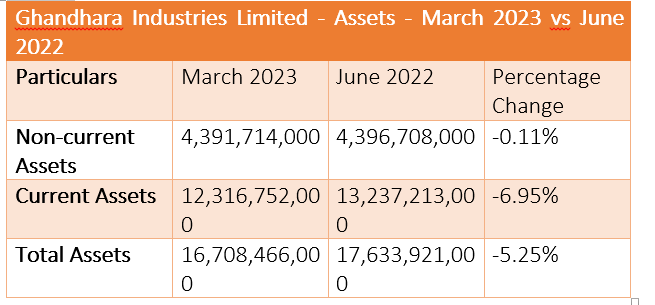
The current assets, including cash, inventory and account receivables, dropped to Rs12.3 billion in March 2023 from Rs13.2 billion in June 2022. The total assets decreased by 5.25% during this time.
Total Equity and Liabilities Analysis
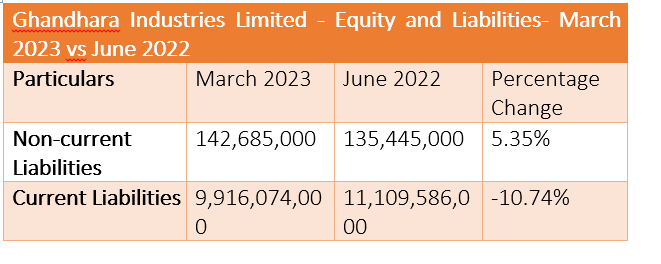

The company’s non-current liabilities increased by 5.35%, whereas the current liabilities decreased by 10.74% between June 2022 and March 2023. Overall, the total equity and liability reduced by 5.25% in March 2023. They stood at Rs16.7 billion in March 2023 against Rs17.6 billion in June 2022.
Company profile
Ghandhara Industries Limited was incorporated in Pakistan on February 23, 1963. The principal activity of the company is to assemble, manufacture and sell Isuzu trucks, buses and pick-ups.
Credit: INP-WealthPk


