INP-WealthPk
Shams ul Nisa
Private equity Dawood Hercules Corporation Limited’s net sales grew remarkably by 486.6% to Rs10.1 billion in the first half of the ongoing calendar year 2023 from just Rs1.72 billion over the corresponding period of 2002. Similarly, the company’s gross profit rose exceptionally by 528.1% to Rs10 billion in 1HCY23 from Rs1.59 billion in 1HCY22. During 1HCY23, the administrative expenses were reduced to Rs84.7 million, resulting in a decline of 33.54% from Rs127.46 million in 1HCY22.
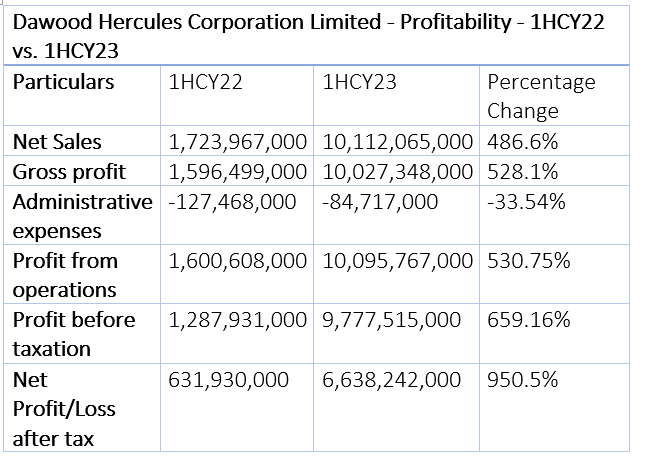

The company’s operating profit increased massively by 530.75% to Rs10.09 billion in 1HCY23 from Rs1.6 billion in 1HCY22. Profit before tax jumped by 659.16% to Rs9.77 billion in 1HCY23 from Rs1.28 billion in 1HCY22. This remarkable hike in revenue, gross profit and profit-before-tax resulted in a magnificent growth of 950.5% in profitability to Rs6.6 billion in 1HCY23 from Rs632 million in 1HCY22. The company’s earnings per share soared to Rs13.79 in 1HCY23 from Rs1.31 in 1HCY22, indicating the stocks of the company were more attractive to investors.
Historical analysis
From 2017 to 2022, the company’s sales, gross profit and operating profit followed an increasing trend. The sales stood at Rs128.59 billion in 2017 and kept rising in the latter years, reaching Rs356.6 billion in 2022. Likewise, gross profit reached Rs104.6 billion in 2022 from Rs34.8 billion in 2017. The operating profit was recorded at Rs31.2 billion in 2017, which soared to Rs94.4 billion in 2022.

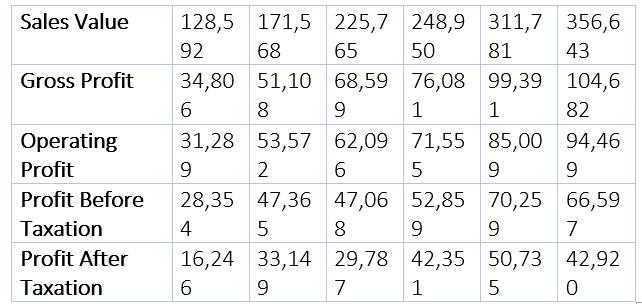
The profit before and after tax fluctuated over the years, but remained quite healthy. In 2017 and 2018, the pre-tax profit had values of Rs28.35 billion and Rs47.36 billion, respectively. In 2019, it declined marginally to Rs47.06 billion, but increased to Rs52.8 billion in 2020 and soared to Rs70.25 billion in 2021. In 2022, it declined to Rs66.59 billion.
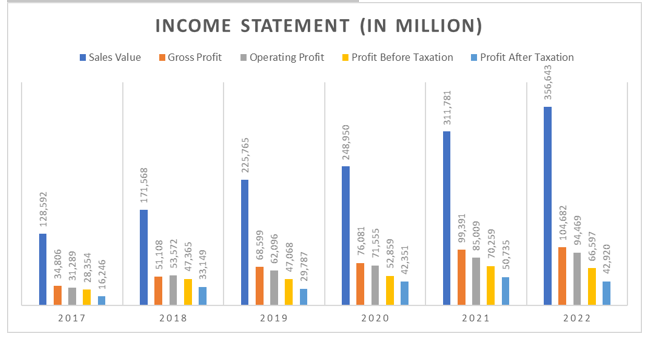
The post-tax profit demonstrated a similar fluctuating pattern from 2017 to 2022. The highest value of Rs50.7 billion was recorded in 2021, with the net profitability witnessing two dips in 2019 and 2022 with values of Rs29.78 billion and Rs42.92 billion, respectively.
Analysis of the balance sheet
The company’s fixed and current assets followed the same increasing pattern from 2017 to 2022. Fixed assets reached Rs329.9 billion in 2022 from Rs162.26 billion in 2017. Likewise, current assets, such as cash, accounts receivables and inventories, moved up to Rs317.9 billion in 2022 from Rs134.3 billion in 2017, reflecting the stable liquidity position of the company.
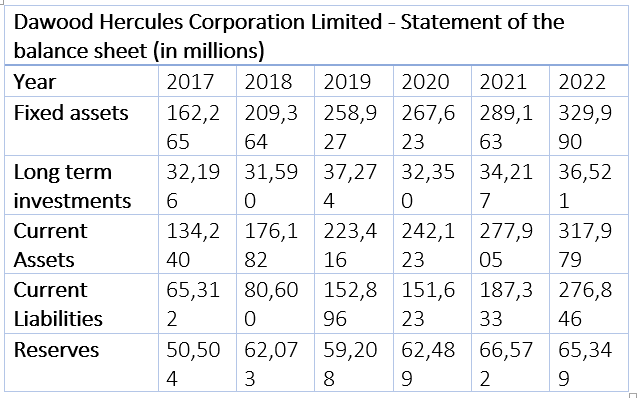
Long-term investments fluctuated over the years, with two dips in 2018 and 2020, with values of Rs31.59 billion and Rs32.35 billion, respectively. The company observed the highest long-term investment of Rs37.27 billion in 2019. The current liabilities of the company increased from the lowest value of Rs65.3 billion in 2017 to the highest obligation of Rs276.8 billion in 2022. However, in 2020, the current liabilities dipped slightly to Rs151.6 billion from the previous year.
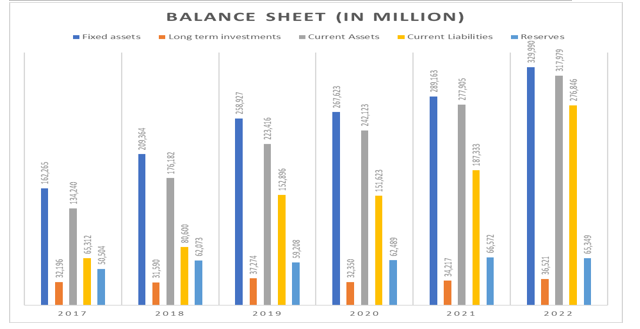
Dawood Hercules Corporation Limited’s reserves fluctuated slightly over time. The highest reserves of Rs66.57 billion were recorded in 2021, and the lowest value of Rs50.5 billion in 2017.


The company’s debt-equity ratio remained below 1 over the years from 2017 to 2022, indicating lower financial risk. The highest value of 0.91 was recorded in 2019 and the lowest of 0.61 in 2017. The current ratio measures a company’s ability to use its current assets to cover its short-term obligations. A company’s short-term obligations rise if the current ratio is below 1.2. Dawood Hercules Corporation’s current ratio was between and above 1.2 and 2, which is considered safe, except in 2022, when it stood at 1.15, indicating risk to cover its obligations.
Similarly, the quick ratio followed the same trend as the current ratio, indicating the stability of the company to cover its obligations as it remained above 1 over these years. The total debt ratio measures the total liabilities in relation to total assets. A ratio greater than 1 shows a high risk to cover liabilities, and a value less than 1 shows low leverage and risk. The company’s quick ratio reflects a stable debt ratio over the years from 2017 to 2022, as it was below 1.
Credit: INP-WealthPk


