INP-WealthPk
Shams ul Nisa
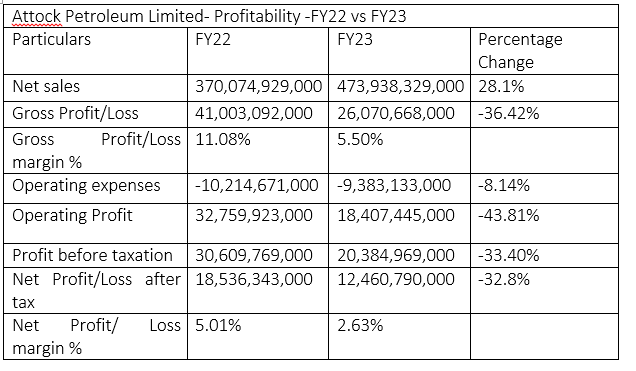
Attock Petroleum Limited’s (APL’s) revenue increased 28.1% to Rs473.9 billion in the financial year 2022-23 from Rs370 billion in FY22. This increase in revenue was not because of the rise in volume of sales but rather the hike in oil prices due to depreciation of local currency and adjustment in petroleum levy. However, the gross profit declined 36.42% to Rs26 billion in FY23 from Rs41 billion in FY22. The company attributed this decline to the inventory losses. Hence, the gross profit margin reduced to 5.50% in FY23 from 11.08% in FY22.


APL’s operating expenses dropped by 8.14% to Rs9.38 billion in FY23 from Rs10.21 billion in FY22. As a result, the company’s operating profit declined sharply by 43.81% to Rs18.4 billion from Rs32.75 billion in FY22. During FY23, the company announced a profit-before-tax of Rs20.38 billion, which was 33.40% lower than Rs30.6 billion in FY22. Similarly, the net profitability reduced by 32.8% to Rs12.4 billion in FY23 from Rs18.5 billion in FY22. APL attributed this decline to natural disasters, high inflation, and slow economic activity during the period under review. This significantly shrank the earnings per share to Rs100.15 in FY23 from Rs148.99 in FY22.
Profitability ratios analysis
The company’s gross profit margin stood at 5.5% in 2018, but dipped to 3.69% in 2019, and to 1.81% in 2020. However, this margin rebounded to 5.29% in 2021 and then shot up to 11.08% in 2022, before pushing down to 5.5% in 2023. The company’s net profit ratio to sales reduced from 3.19% in 2018 to 1.78% in 2019, and further dipped to 0.5% in 2020. However, the net profit margin reverted to a more stabilising position of 2.61% in 2021 and further improved to 5.01% in 2022 before coming down to 2.63% in 2023.


The operating leverage, which measures the ability of a company to increase its operating income by raising its sales, remained positive in 2018, 2020 and 2022, showing that sales kept increasing during these years. However, the operating leverage remained negative in 2019, 2021 and 2023, indicating a drop in sales. The return on equity reduced from 32.59% in 2018 to 30.19% in 2023. The company recorded the highest return on equity of 61.75% in 2022 and the lowest of 5.4% in 2020. The total shareholders’ returns are the amount of money shareholders make in each stock they hold. Over the years, the total shareholders' return has grown from 0.97% in 2018 to the highest of 31.01% in 2023. However, in 2019 the company witnessed a negative total shareholders’ return of 34.95%.
Liquidity ratios analysis
The current ratio gauges a company's capacity to pay its short-term obligations with its current assets. The current ratio of less than 1.2 indicates a company faces a greater risk of being unable to pay its short-term obligations using current assets. If the current ratio is between 1.2 and 2, a company is regarded as safe. APL’s current ratio remained above 1.2 over the years from 2018 to 2023, showing the stable capacity of the company to cover its obligation with current assets.

However, the quick ratio remained below 1 from 2018 to 2022 and stood at 1.05 in 2023. The quick ratio below 1 shows a company might not be able to cover its short-term obligations, using its current assets. Though the cash-to-current liabilities ratio remained below 1 over these years, it improved from 0.19 in 2018 to 0.73 in 2023, indicating the company was able to cover 73% of its short-term obligations using cash in 2023. The cash flow from operations to sales ratio measures the ability of a company to generate cash from its sales. The company improved its cash generation over the years, reaching the highest of 0.08 in 2023.
Credit: INP-WealthPk


