INP-WealthPk
Hifsa Raja
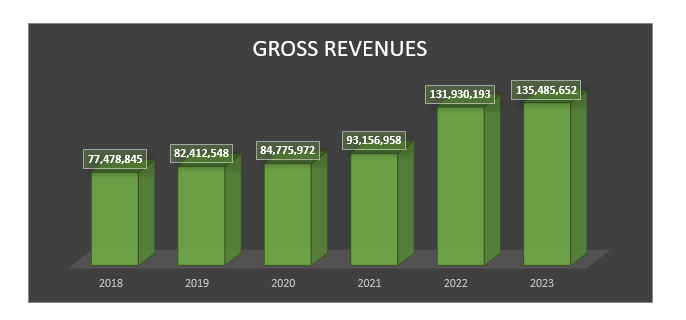
Atlas Honda Limited (ATLH) produced record-breaking gross sales in its own fiscal year, which starts from April 1 and runs through March 31.
The motorcycle maker posted a gross revenue of Rs135 billion during the year, showing an upward trajectory since 2018. However, the record sales were just 3% higher than the FY22 sales of Rs132 billion.
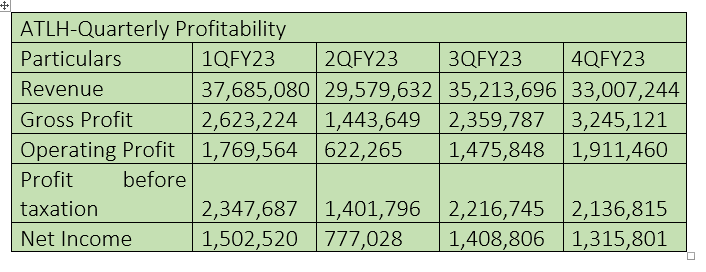
The company posted the highest sales of Rs37 billion and the highest net profit of Rs1.5 billion in the first quarter (April-June) of FY23, and the highest gross profit of Rs3.2 billion in the fourth quarter (January-March).
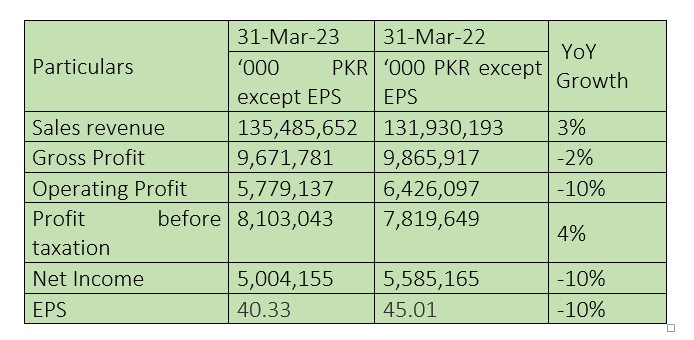
FY23 compared with FY22 Top of Form
ALTH experienced a slight 2% decline in gross profit, which stood at Rs9.6 billion compared to Rs9.8 billion in FY22.
One notable aspect was a decrease in the operating profit during FY23. Despite this, the company managed to achieve a 4% growth in profit-before-tax, which stood at Rs8.1 billion in FY23, surpassing the previous year's pre-tax profit of Rs7.8 billion.
The profit-after-tax for FY23 witnessed a decline, with a recorded figure of Rs5 billion compared to Rs5.5 billion in FY22, reflecting a decrease of 10%.
These financial results highlight the mixed performance of the company with a slight increase in sales revenue but a decline in gross and net profits. The company will need to assess and strategise accordingly to ensure sustainable growth and profitability in the upcoming fiscal year.
![]()
Earnings Per Share
Over the past few years, the earnings per share (EPS) of the company have shown varying trends. Notably, in 2018, the EPS experienced a remarkable surge, reaching an impressive value of Rs45.1. However, subsequent years saw a decline in the EPS, with it plummeting to just Rs24.8 in 2020.
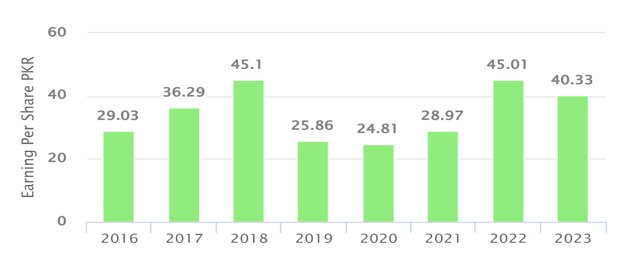
In a positive turn, the company witnessed an increase in EPS in 2022, with it climbing back up to Rs45. However, the EPS dropped slightly to Rs40.33 in 2023.
These fluctuations in EPS reflect the dynamic nature of the company's financial performance, showcasing periods of significant growth as well as periods of decline. Investors and stakeholders will closely monitor these developments to gauge the company's profitability and make informed decisions.
It remains to be seen as to how the company will strategise and capitalise on these fluctuations in the coming years to maintain a steady and upward trajectory for its earnings per share.
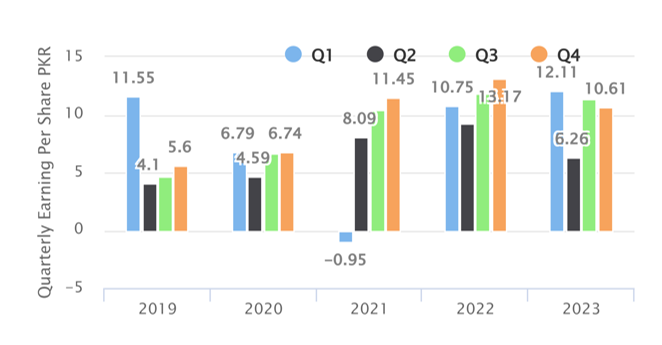
In the latest financial update for fiscal 2022-23, the company's earnings per share showcased a mixed performance across the quarters. During the first quarter, the company reported a robust EPS of approximately Rs12.11, indicating a promising start to the year. However, the second quarter witnessed a decline in EPS, falling to Rs6.26. Fortunately, the company managed to rebound in the following quarter, with the EPS rising to Rs10.61, demonstrating a noteworthy recovery. As the financial year progressed, the company's EPS remained relatively stable in the fourth quarter, with a slight decline.
Ratio analysis
In the first quarter of FY23, the firm’s gross profit margin stood at 6.96%, indicating the management was doing an excellent job of generating revenue while considering the cost of providing the company's products and services. The net profit margin in this quarter stood at 3.99%. This indicates effective financial management and control over expenses. Operating profit margin was 4.70% for 1QFY23, signifying the company's ability to generate profits from its core operations, highlighting sound business strategies and operational efficiency. Overall, the company's performance in the first quarter of FY23 reflects a strong financial position and effective management, setting a positive tone for the year ahead.

In the second quarter, operating, net, and gross profit margin numbers all decreased. The gross profit margin dropped a bit to 6.05%, net profit margin to 3.39% and operating profit margin to 3.56%. These numbers suggest the company faced challenges in maintaining profitability and efficiency during the second quarter of FY23. It may be necessary for the company to reassess its operations and financial strategies to improve its profit margins. During the third quarter, there was a positive turnaround as all the values showed an increase.
The gross profit margin increased to 6.27%, indicating the company’s ability to produce profits from costs of goods sold. The net profit margin improved to 3.60% and operating profit to 3.77% in 3QFY23. These positive changes suggest the company successfully implemented strategies to boost its profitability and operational efficiency during the third quarter. It indicates a positive trajectory for the company's financial performance and signifies the effectiveness of its management decisions and business operations.
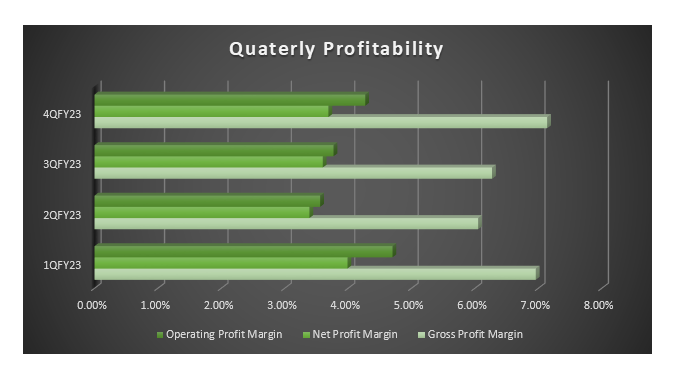
The fourth quarter of FY23 proved to be a remarkable period for the company, with significant improvements observed across all key performance indicators. This quarter stands out as the best performing quarter based on the ratio analysis. During the period, the gross profit margin reached an all-time high of 7.14%. The net profit margin also demonstrated a positive trend and reached 3.69%.
Moreover, the operating profit margin also showed a positive trend and reached 4.27%. The consistent increase in these values throughout the quarter demonstrates a positive trend and highlights the company's ability to deliver strong financial performance. These improvements signify the effectiveness of the company's strategies and the dedication of its management in driving sustainable growth and profitability.


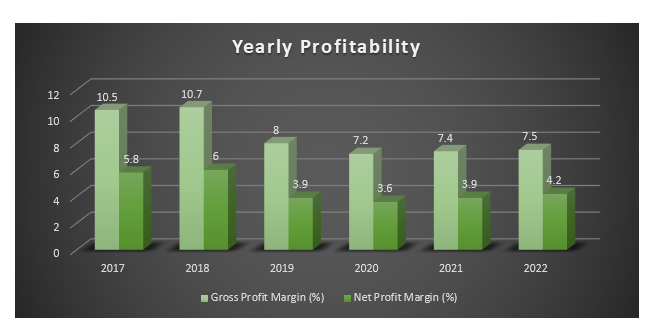
The company's financial performance was strong in 2018 as it posted significant increases in gross profit and net profit margins. The decline in the net profit margin to 3.9% in 2019 and the drop in the gross profit margin to 8% point to expenses other than cost of goods sold. The profitability edged lower in 2020, but rebounded over the next two years from 2021 to 2022.
Profit or loss over the years
While net sales were consistent and improved over the previous six years, the gross profit exhibited a mixed tendency, peaking in 2018 and then again in 2022. The Covid-19 pandemic-induced lockdowns in 2020 led to a slight decline in gross profits.
Price prediction using Machine Learning
The future stock close prices of ALTH were predicted in a ground-breaking analysis using a state-of-the-art machine learning approach. The model used 20 years of historical data from 2003 to 2023 to make precise forecasts. The model utilises the capabilities of a specialized recurrent neural network called Long Short-Term Memory (LSTM). This brings in a new era of financial forecasting and illustrates how machine learning has the power to fundamentally alter investing approaches.
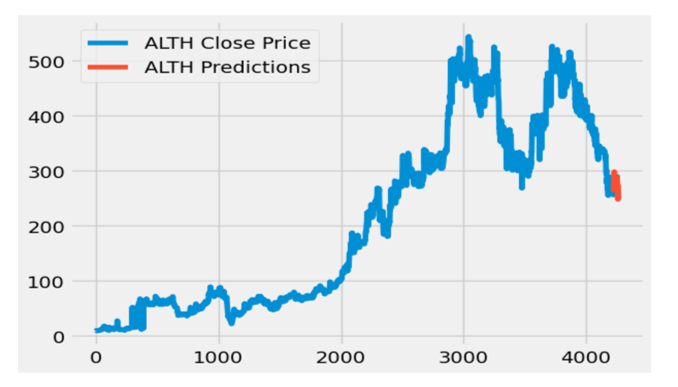
Finally, the model plots the actual stock prices (labeled as "ALTH Close Price") and overlays the predicted prices (labeled as "ALTH Predictions") on the same graph. This visualisation allows for a visual comparison between the actual and predicted values, helping to assess the performance of the model. The model predicts that the prices of the stock will fall in the future.
Company profile
ALTH was established as a public limited company under the Companies Act, 1913 (now the Companies Act, 2017) on October 16, 1962. The company's main business is the innovative production and marketing of bikes and accessories. The company is a subsidiary of Shirazi Investments (Private) Limited, which held 52.43% of issued, subscribed and paid-up capital of ALTH as of March 31, 2021.
Atlas Honda has a long history of continuous investment in its facilities. The company is committed to identifying new markets and expanding its dealerships, providing avenues for business growth and providing shareholders the desired return on investment.
Credit : Independent News Pakistan-WealthPk


