INP-WealthPk
Shams ul Nisa
Amreli Steels Limited has reported a net profit loss of Rs678.4 million in FY2023 as against a net profit of Rs1.32 billion in the corresponding period last year, registering a decline of 151.2%, reports WealthPK. The company’s annual financial report for FY2023 attributes this massive reduction in net profitability to the rise in deferred tax liabilities due to an increase in supper tax. During this period, the steel demand plunged as the prices of steel hiked due to persistent increases in inflation. The company’s sales dropped by 21.8% to Rs45.49 billion in FY23 from Rs58.18 billion in FY22.
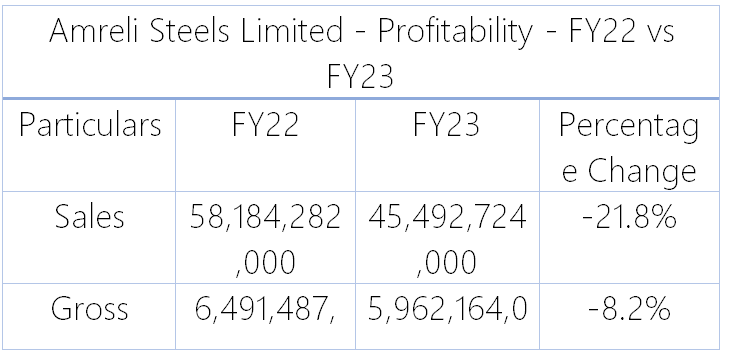
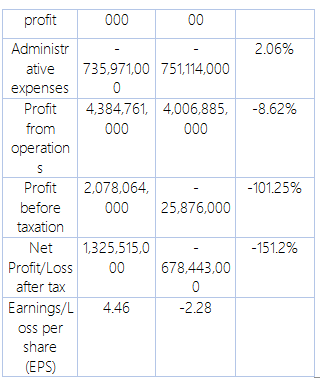
The cost of construction spiked due to high inflation, import restrictions, and fast currency depreciation. Meanwhile, increasing energy prices added to the rise in the prices of goods, causing the gross profit to tumble by 8.2% to Rs5.9 billion in FY23 from Rs6.49 billion in FY22. In FY23, the administrative expenses stood at Rs751.1 million compared to Rs735.9 million in FY22, posting a 2.06% rise over the period. The soaring energy prices pushed up the prices of raw materials, bringing many operations such as construction projects to a halt. As a result, the operational profit declined by 8.62% to Rs4.0 billion in FY23 from Rs4.38 billion in the same period last year.
The company registered a loss before tax of Rs25.8 million in FY23, which is 101.25% lower than the profit before tax of Rs2.07 billion in FY22. The steel manufacturing company ended up in a loss per share of Rs2.28 in FY23 compared to earnings per share of Rs4.46 in FY22.
Income statement analysis
The steel manufacturing company's net turnover varied over the years; it stood at Rs15.5 billion in 2018 and reached its highest of Rs58.18 billion in 2022 but fell to Rs45.49 in 2023. The gross profit followed a decreasing trend from 2018 to 2020 with a value of Rs2.7 billion to Rs1.8 billion. However, in the later years — 2021 and 2022 — they grew to Rs4.5 billion and Rs6.49 billion but reduced to Rs5.9 billion in 2023.
![]()
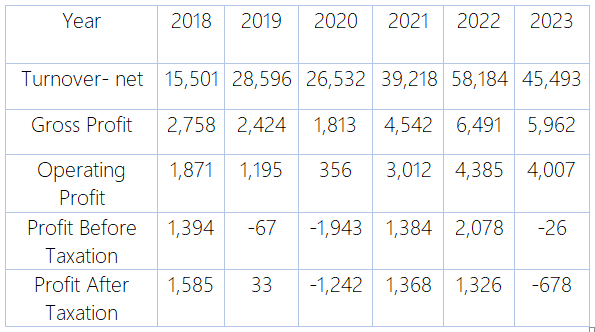
The operating profit followed a similar trend, recording the highest of Rs4.38 billion in 2022 and the lowest of Rs1.8 billion in 2018. The company observed a mixed result of profit before tax over the 2018-2023 period. In 2019, 2020, and 2023, the steel manufacturing company faced a loss before tax of Rs67.0 million, Rs1.9 billion, and Rs26.0 million. However, in 2018, 2021, and 2022 the company recorded profit before tax of Rs1.39 billion, Rs1.38 billion, and Rs2.07 billion.
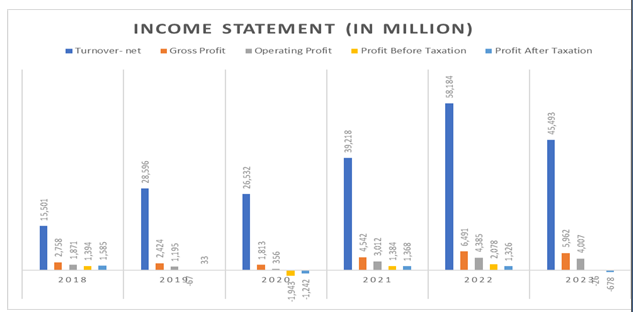
As a result, the company posted a net profit of Rs1.58 billion, Rs33.0 million, Rs1.36 billion, and Rs1.32 billion in 2018, 2019, 2021, and 2022. However, in 2020 and 2023, the company observed a loss after tax of Rs1.24 billion and Rs678.0 million.
Balance sheet analysis
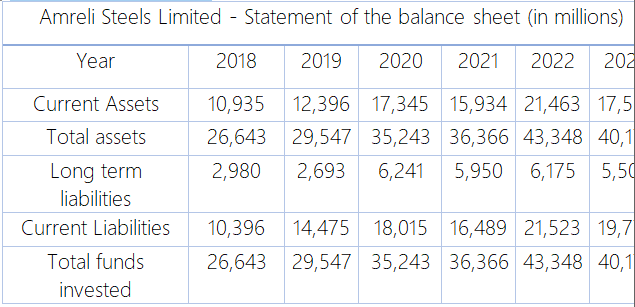
The current assets demonstrated a fluctuating trend from 2018 to 2023. The highest value of Rs21.46 billion was recorded in 2022. The current assets witnessed two dips in 2021 and 2023 with values of Rs15.9 billion and Rs17.5 billion, respectively. The total assets followed an increasing pattern from 2018 with values of Rs26.6 billion to the highest of Rs43,34 billion in 2022 but reduced to Rs40.17 billion in 2023.

The long-term liabilities grew in 2018, 2020, and 2022 but observed dips in 2019, 2021, and 2023. Overall, the current liabilities increased from Rs10.39 billion in 2018 to Rs19.77 billion in 2023. The obligations witnessed one dip in 2021 with a value of Rs16.48 billion. The company’s total funds invested grew from Rs26.6 billion in 2018 to Rs43.3 billion in 2022. However, they reduced to Rs40.17 billion in 2023.
Ratio analysis
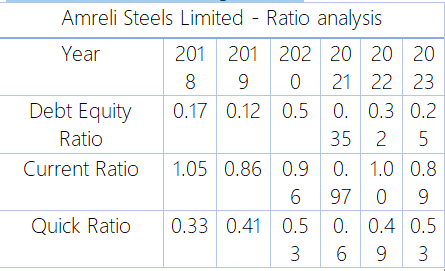
The steel manufacturing company’s debt-equity ratio remained below 1 over the period 2018 to 2023, indicating lower financial risk. The highest value of 0.5 was recorded in 2020 and the lowest of 0.12 in 2019. The current ratio measures a company’s ability to finance its short-term obligations using its current assets. A company risks covering its short-term obligations rise if the current ratio lies below 1.2. The company’s current ratio lies between and above 1.2 and 2, which is considered safe. However, the current ratio remained below 1.2 over the years, indicating an increasing risk to cover its short-term obligations.
![]()
The quick ratio remained below 1 over the years 2018 to 2023, indicating the higher risk as it doesn't have enough quick assets to meet all its short-term obligations. A company’s debt service ratio gauges the ability to cover debt obligations using the cash generated from operating activities. Debt service ratio above 1 is considered safe but most lenders prefer between 1.2 and 1.4 and the most ideal ratio is above 2. The steel manufacturing company recorded the highest debt service ratio of 2.97 in 2018 followed by a stable ratio of 1.46 in 2021 and 1.5 in 2022. However, it remained below 1 in 2019, 2020 and 2023.
Credit: INP-WealthPk


