INP-WealthPk
Shams ul Nisa
Agha Steel Industries Limited’s net turnover declined 19.8% to Rs20.58 billion during the year ended June 30, 2023 from Rs25.6 billion in the previous year. The company’s gross profit plunged 12.21% to Rs4.82 billion in FY23 from Rs5.49 billion in FY22. The main factors behind this loss were high inflation, energy shortages, and foreign currency shortfall to pay for the raw material. Due to shortage of foreign currency reserves and stagnant remittances, the government allowed currency depreciation that caused high inflation. This contracted industrial activity during the period under review.
As a result, the cost of sales also reduced, causing the company’s gross profit margin to inch up to 23.42% in FY23 from 21.41% in FY22. On the expenses side, the company’s administrative costs dropped by 7.08% to Rs310.9 million in FY23 from Rs334.6 million in FY22. According to the company’s financial report, its operating profit during FY23 fell a significant 63.22% to Rs980.5 million from Rs2.66 billion in FY22.

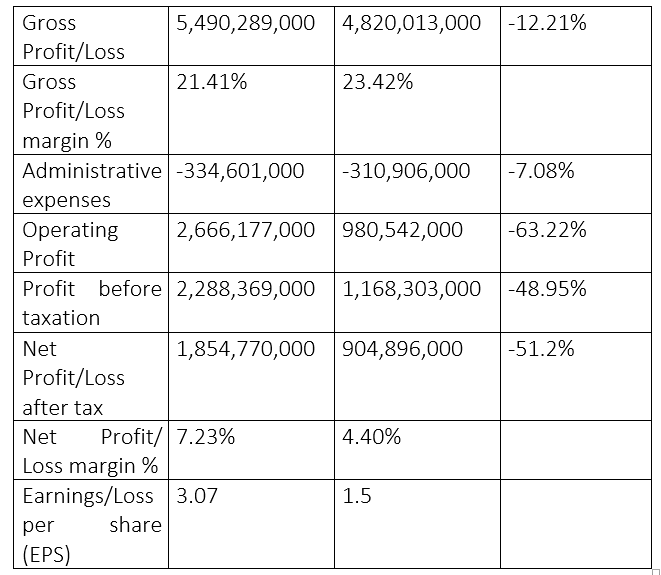
Similarly, the company’s profit-before-tax fell 48.95% to Rs1.16 billion during FY23 from Rs2.28 billion in FY22. Agha Steel Industries' net profit stood at Rs904.89 million in FY23 compared to Rs1.85 billion in FY22, registering a significant fall of 51.2%. Resultantly, the steel company's net profit margin dipped to 4.405% in FY23 from 7.23% in FY22. Consequently, the earnings per share reduced to Rs1.5 in FY23 from Rs3.07 in FY22.
Analysis of profitability ratios
Agha Steel Industries’ gross margin remained relatively stable as it ranged between 19% and 25% from 2019 to 2023. The operating margin remained the same at 5% in 2019 and 2023. However, it fluctuated from 2020 to 2022, with the highest operating margin of 13% recorded in 2021. The net margin followed a similar pattern, remaining the same at 4% in 2019 and 2023, but fluctuated in between. The highest 10% net margin was recorded in 2021. The company’s return on equity after tax increased from 14% in 2019 to 25% in 2021, but declined substantially to -25% in 2023. This can be because of the decrease in net margin.
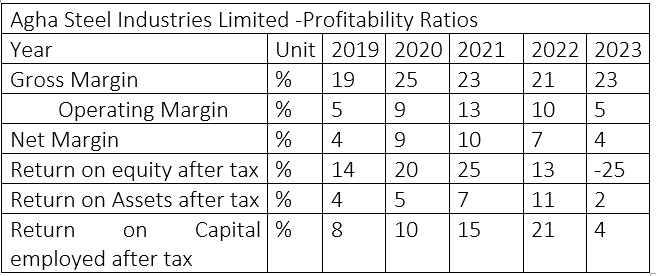
The steel company recorded the highest return of 11% on assets after tax in 2022 and the lowest of 2% in 2023. Similarly, the return on capital employed after tax increased from 8% in 2019 to the highest of 21% in 2022, but then declined to 4% in 2023.
Liquidity ratios analysis
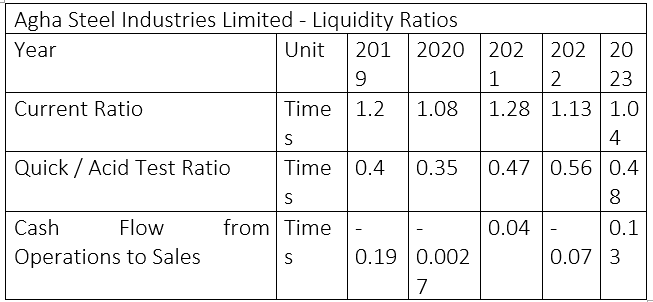
The current ratio evaluates how well a business can use its current assets to pay for its short-term liabilities. A current ratio that is between 1.2 and 2 is seen as safe, whereas one that is below 1.2 puts the company in greater danger of not being able to pay its short-term obligations. Over the years, the steel company witnessed a current ratio below 1.2, indicating increasing risk of covering its obligations using its assets.
The steel company recorded a maximum value of 1.28 in 2021. The quick ratio remained below 1 from 2019 to 2023, showcasing the company’s lower ability to cover its short-term obligations. The cash flow from operations remained negative in 2019, 2020, and 2022 with values of -0.19, -0.0027, and 0.07, respectively. However, it remained positive in 2021 and 2023 with values of 0.04 and 0.13, respectively.
Analysis of capital structure ratios

The gearing ratio measures the degree of a company’s financing operations by shareholders' funds or equity capital versus creditors' funds or debt financing. A higher gearing ratio indicates greater financial risk for the company, as it has more debt than equity. Over the years, Agha Steel Industries has shown a greater gearing ratio ranging from 58% to 71%, which implies the company has borrowed more funds from creditors than its shareholders. The cost-of-debt ratio of a company is the total interest expense owed on debt it accumulates. The cost-to-debt ratio of the steel company varied between 7% and 14% over the years. The debt-to-equity ratio measures a company’s financing of assets through borrowing or by the shareholders' equity. A debt-to-equity ratio greater than 1 indicates that most of the company’s assets are financed through borrowing and less than 1 means assets are financed through shareholders’ equity.
The steel manufacturing company’s debt-to-equity ratio has remained above 1 from 2019 to 2023, indicating more assets financing through borrowing. The interest coverage ratio measures a company’s ability to pay interest on outstanding debts using the company’s profitability. A higher interest cover ratio indicates a stronger financial ability to finance interest payments. A ratio below 1.5 is considered risky for the company to pay interest payments. The steel manufacturing company had an interest cover ratio greater than 1.5 over the years from 2019 to 2023, showing the stronger financial health of the company.
Credit: INP-WealthPk


